cessing capabilities, they are currently relevant to
a much broader range of data. A simple example of
the breadth of data from which information can be
visually extracted is band combinations, one of the
most elementary but also complex image enhance-
ment methods. For example, with the six optical
bands of Landsat TM or ETM data, there are about
120 three band combinations that may be created
with the standard red, green, and blue display.
Similar to band combinations, there are many
indices to emphasize specific features created
from various bands of multispectral imagery
including snow and ice, green vegetation, burn
scars, and bare soil among others. Also most fine
spatial resolution sensors have a single panchro-
matic band and then several multispectral bands
at slightly coarser spatial resolutions which are
often combined in one of several methods of so-
called pan-sharpening to improve visual inter-
pretation. In essence, the entire range of image
enhancements can be directed towards products
for visual interpretation. These are often divided
into spectral, radiometric, or spatial enhance-
ments (Jensen 2007). Among the other methods
of producing an image for improved information
extraction are multi-sensor data stacks such as
optical and radar, multitemporal, and combina-
tions with non-remote sensing data – for example
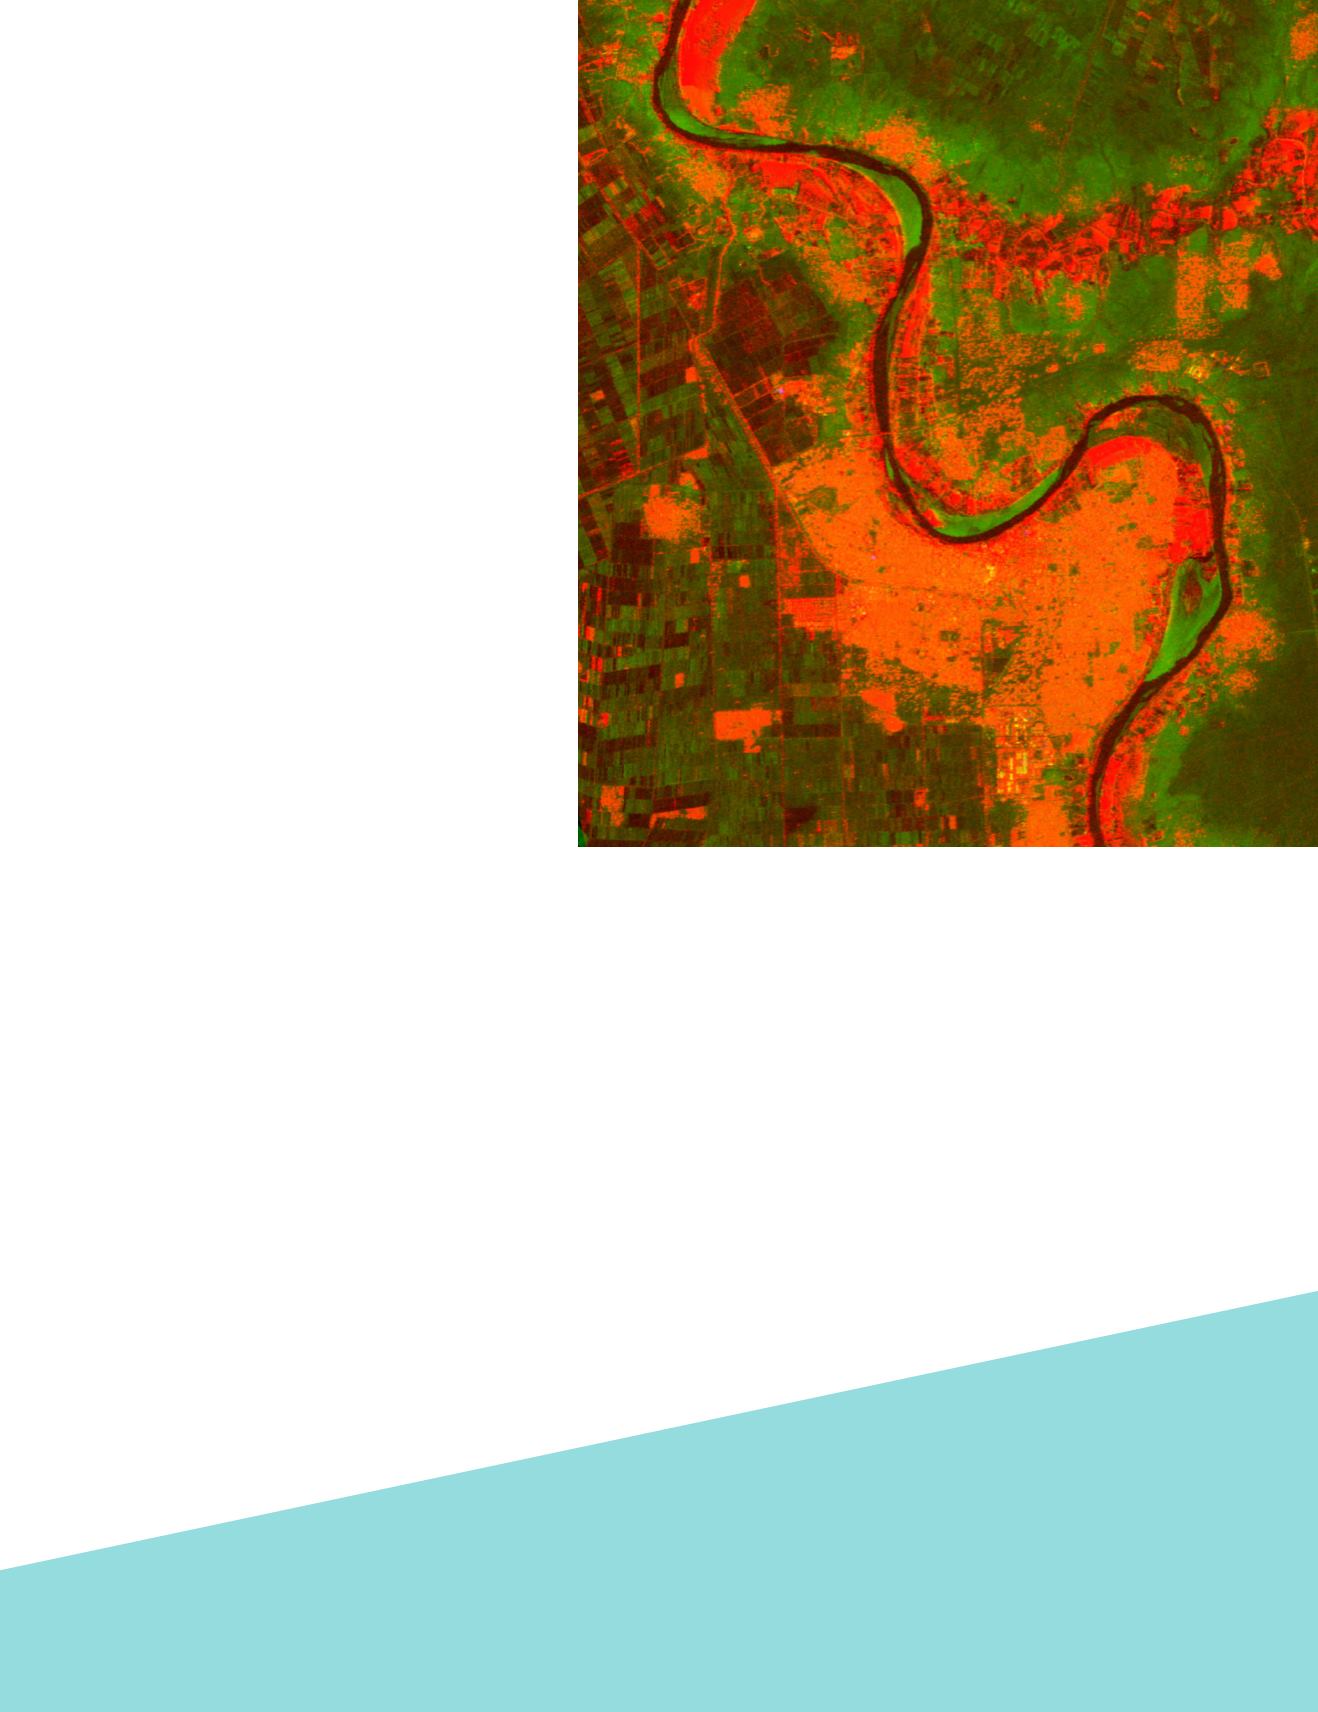
creating a three dimensional image by draping
remote sensing data over a digital elevation model
(Figure 1).
A difficulty with visual analysis is that it can be very sub-
jective. An image that is useful for one scientist may not be
equally useful for another because of their prior experience
or how they perceive color or spatial relationships. Some
individuals are much more adept at understanding a map
or an image and have more success at visual remote sensing
interpretation of features than others. The best visual image
interpreters often have a disciplinary background such as
forestry, agriculture, or wetlands on which they focus and
to which they bring extensive field experience and subject
matter knowledge to interpreting imagery.
The improvements in sensors since black and white
photography have made visual image interpretation more
relevant today as there are so many ways to create an
image to meet specific needs. There is often an expectation
or request for a recipe or “cookbook” for which image
presentation is best for a specific application. A number
of workable “cookbooks” or photographic keys have
been developed for a range of applications using simple
panchromatic aerial photography as well as color aerial
photography. In an early example Ryerson and Wood (1971)
developed a key to identify livestock farm types in southern
Ontario. A number of these have been produced for a variety
of crop types and have been identified in Philipson (1997).
Others have attempted to develop specific approaches for
use with far more complex sensors including satellite data
with varying results. Brown et al. (1983) developed an easily
interpreted and widely used enhancement for Landsat data
to bring out detail on rangeland quality.
Figure 1. Wad Madani, Sudan. Optical and radar fusion for improved image
interpretation. Palsar VV, ASTER visible red and Radarsat VH texture in RGB.
Approximate image size is 17 x 17 km.
PHOTOGRAMMETRIC ENGINEERING & REMOTE SENSING
December 2017
799


