There are lists of the best Landsat Operational Land Imager
(OLI) band combinations and color assignments for various
features or applications such as agriculture or forestry. The
Canada Centre for Remote Sensing produced a number of
user information notes that suggested band combinations
and color assignments to identify and map certain features
in forestry and agriculture (Canada Centre for Remote Sens-
ing 1986). However, these are limited in part because of the
subjective process of visual interpretation and variability in
images related to date of acquisition, local variations in to-
pography, and atmospheric effects. Therefore, one finds few
“cookbooks” for visual interpretation of imagery collected by
more complex sensors.
As sensors become more complex and the imagery becomes
more complicated, it would seem obvious that the remote
sensing community should place greater emphasis on the
process of visual interpretation. This is so because machine
methods tend to deal with tone or color and some limited
spatial relationships – but not the more complex factors
typically better recognized and taken into account by visual
interpretation. It is a process that is best learned by ex-
perience and the more images individuals examine the
more comfortable and competent they will become. Image
interpretation skills, as most activities, can be seen to have
a progression from simple to more complex. It is best to
begin with the familiar and move to the less familiar and
more complex imagery. From that perspective beginning
with panchromatic or true color aerial photography is most
appropriate. In addition, beginning with images of a local
environment such as the city or even university or college
where the educational activity takes place provides more
familiarity and confidence. The educational process can
then be elevated to more complex sensors and
enhancements that improve the competency
of the students.
I
mage
I
nterpretation
E
xamples
The concern of the authors is that the remote
sensing community does not provide suffi-
cient visual interpretation preparation for the
workforce in either the university or college
environment, nor within much of the in-ser-
vice training provided by employers. This is
especially important as visual interpretation
is often an unrecognized or unacknowledged
component of many of the activities of infor-
mation extraction in remote sensing. These
activities can be by traditional image inter-
pretation from a broad range of products or a
combined methodology of machine and visual.
The following sections provide examples of
these activities.
Visual Interpretation
Despite the attention given to spaceborne platforms and
more complex sensors including multispectral, hyperspec-
tral, and radar, the dominate source of remote sensing data
for most users is still traditional aerial photography, albeit
now largely acquired digitally or replaced by fine spatial res-
olution satellite imagery. A decade ago Modello et al. (2008)
in the ASPRS industry forecast determined that over 60%
of current remote sensing data used in one way or another
was aerial photography. Today a similar study on imagery
most often used would likely add fine spatial resolution
satellite imagery to the aerial photography. For a multitude
of applications the analysis of these data, whether aerial
photography or fine spatial resolution satellite data, needs
visual interpretation.
Primary users of aerial photography are units of local gov-
ernments. The frequency of photo acquisition by these units
is often dependent on the amount of change in a jurisdiction
and budgetary constraints. In some US counties and Cana-
dian cities it is as frequent as annually. Local governments
often use the photography for updating LULC maps as well
as for zoning decisions and transportation planning. The in-
formation extraction for these applications is almost entirely
visual. It is also common for the information extraction to be
outsourced internationally to lower costs, and this further
reduces the local knowledge applied to the interpretation.
The US Department of Agriculture (USDA) annually collects
primarily color infrared photography at 1 m spatial reso-
lution during the growing season for most of the US under
the National Agriculture Imagery Program (NAIP). There
800
December 2017
PHOTOGRAMMETRIC ENGINEERING & REMOTE SENSING
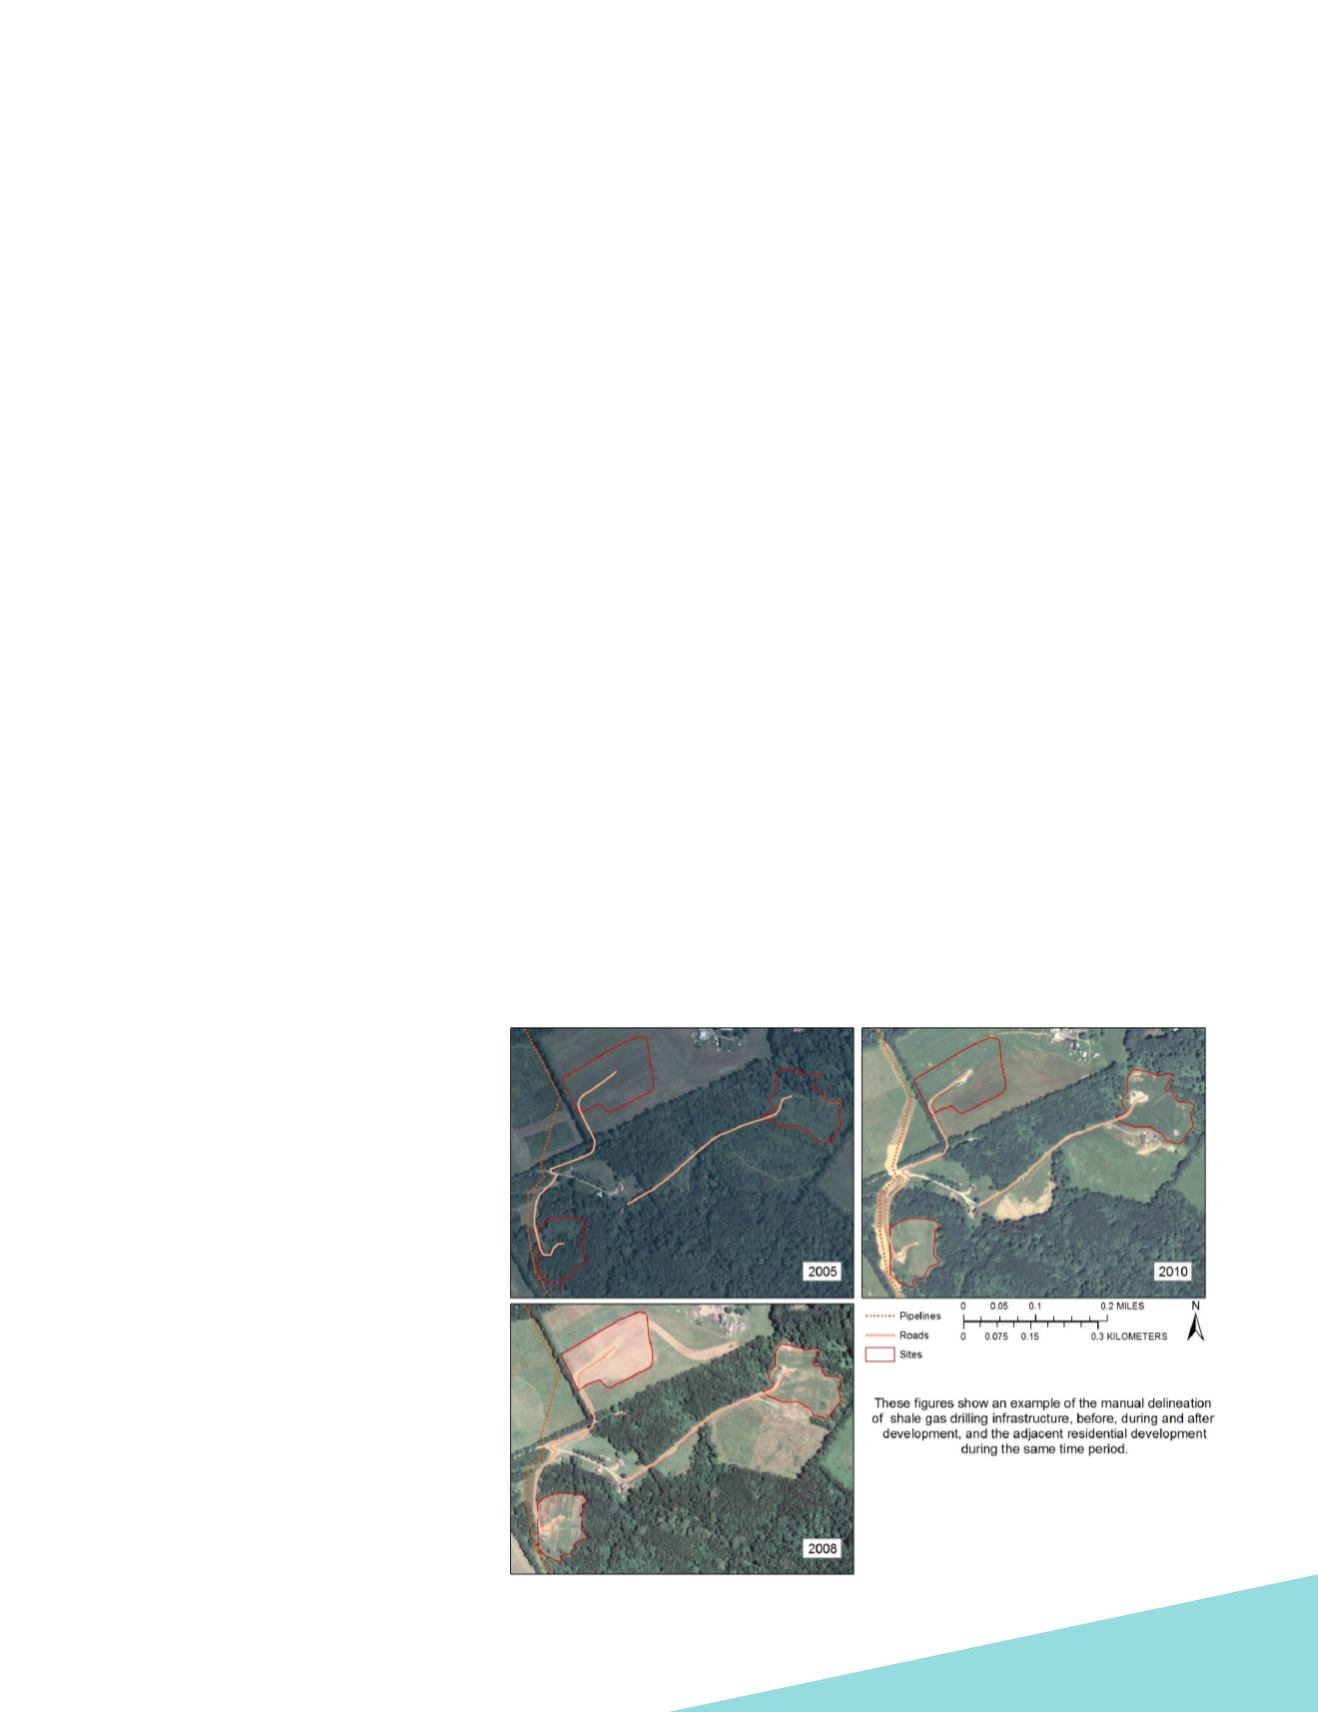
Figure 2. NAIP photograph with visually delineated fracture industry features.


