708
October 2019
PHOTOGRAMMETRIC ENGINEERING & REMOTE SENSING
SECTOR
INSIGHT:
.
com
able online. This availability ranges from
data collected from in-situ measurements
(e.g. climate data from the UN WMO) to
remote-sensing products (e.g. from NASA
and ESA) as well as model outputs (e.g.
from academia, IPCC). An exciting new
development is the ability to do more and
more powerful analysis online – ranging
from drawing a watershed at any giv-
en point, the use of powerful cloud com-
puting platforms to do complex scenario
modeling, or creating user interfaces to
run these analytics online with custom-
ized parameters and visualize the results
shared through appropriate data services
and APIs. Many of these geospatial data
are free or can be made free (e.g. with an
organization absorbing the costs of de-
velopment/customization, subscription,
or training) to expand their use. Much of
the emerging technology talent around
the world can be engaged (e.g. through
online learning, internships, hackathons,
entrepreneurship, and employment) and
tapped to contribute to developing and
using such online data and analytic ser-
vices to make Apps, Portals, interactive
e-books, and decision support systems for
the benefit of the poor and disadvantaged.
It is useful to imagine the possibilities.
Someone in a poor slum can access a
world of information and analytics to
determine if the flood forecast next week means they must
head to higher ground with their family. A water agency in
Ethiopia or Cambodia can have access to water accounting
tools to better manage their basins. Any small irrigation sys-
tem or check dam operator can access relevant data (e.g. soil
moisture, plant growth, storage levels, etc.) based on a com-
bination of in-situ, earth observation, and AI-leveraged cloud
analytics in order to better inform their decisions and go up
the data value chain of data
information
knowledgedeci-
sion support.
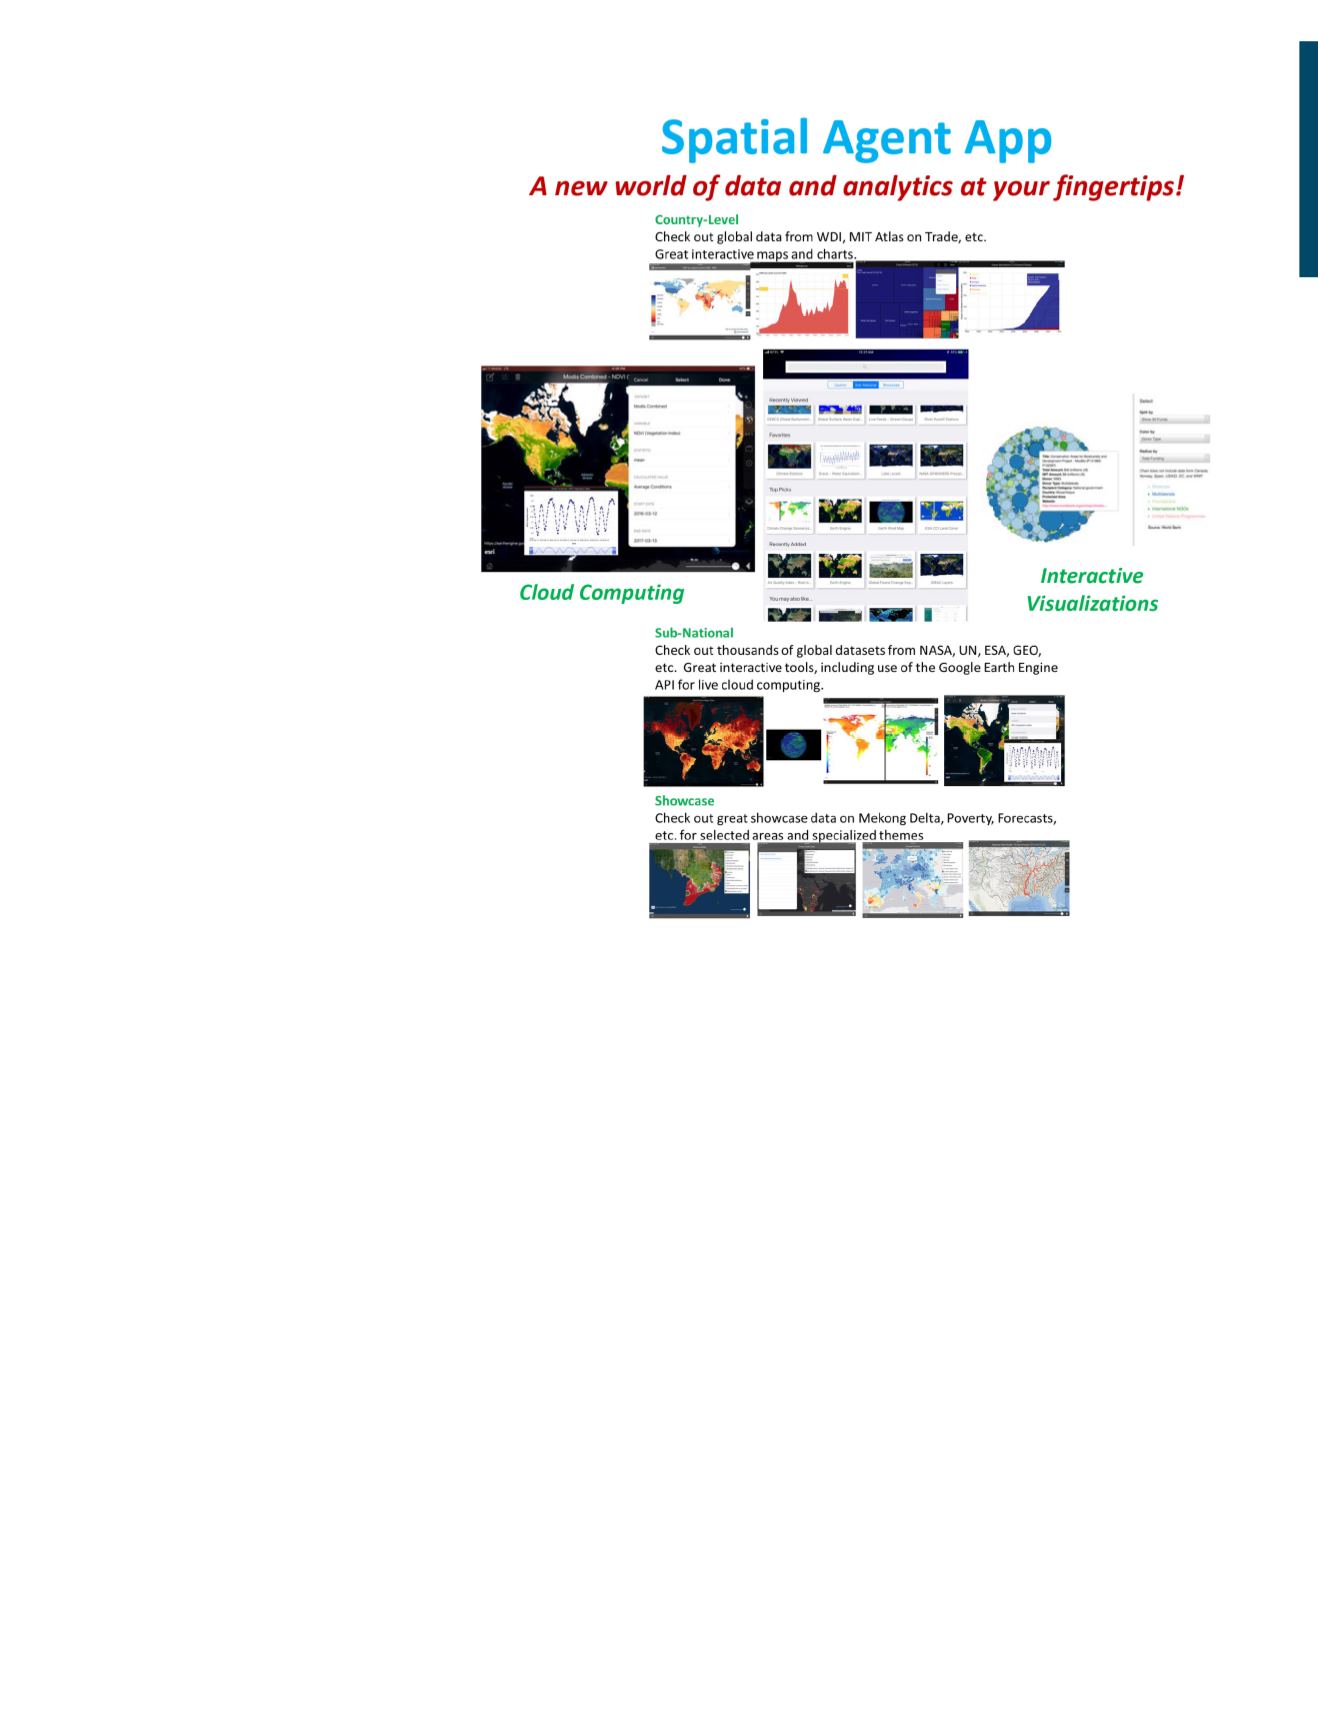
A new generation of platforms is emerging that can help
showcase this exciting new world of free online data and
analytics at one’s fingertips. At theWorldBank, we are helping
to develop a range of these tools – e.g. the Spatial Agent
app, figure 2 (currently available in iOS and being updated
on Android – more information can be found at
.
worldbank.org/content/spatial-agent-tutorial). Also, a range
of related web-based sub-portals that are all being constantly
upgraded are available at (e.g. see
.
org/HydroInformatics/. Spatial Agent provides interactive
visualizations on country-level data (e.g. GDP per capita or
key imports and exports) and sub-national data (e.g. historical
climate trends at any station, population distribution from
many different sources, natural disasters, urban population
growth projections, etc.). This is done with a combination
of clickable and interactive maps and graphs, animations,
swipe comparisons, showcasing external websites, and other
visualizations (including the use of powerful frameworks
like D3). Use of the Google Earth Engine API illustrates the
power of free, powerful cloud computing tools to undertake
complex analysis (e.g. to spatially and temporally analyze
NDVI, rainfall, deforestation, etc.) while consuming free
data. You can learn more about the data through appropriate
metadata and export the visualizations to yourself on email
or share on social media.
Spatial Agent is illustrative of how we can help access, ana-
lyze, and visualize data from several different online sources
on the same platform. As we start getting deluged with an ex-
ponential growth in free and subscription data and analytical
services, it is important that there is a way to know what is
already available and curate the geospatial data for easier ac-
cess. As more local, national, regional, and global institutions
Figure 2. The World Bank Spatial Agent App.


