Study Area and Data Sets
Study Area
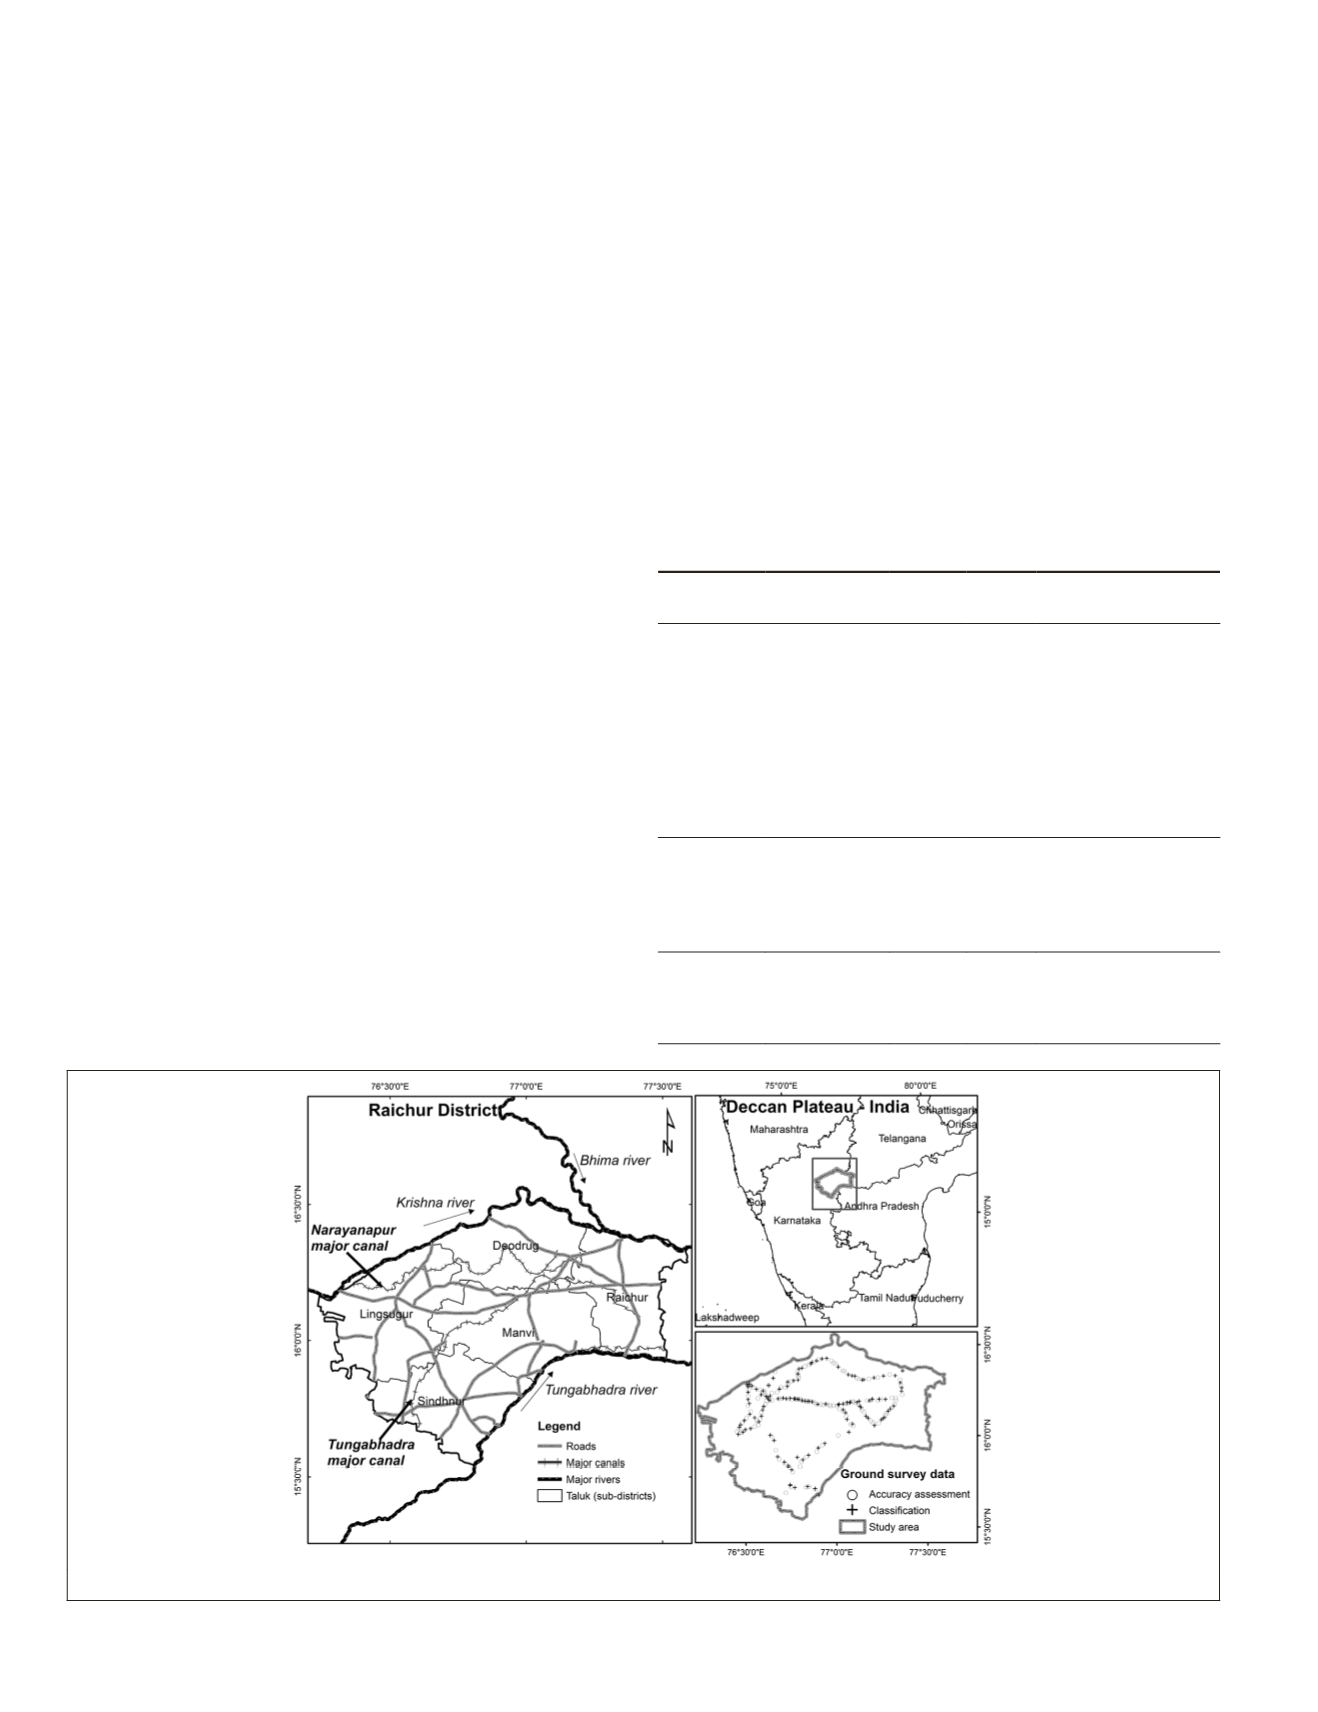
Raichur is one of largest and most productive rice growing
district in Karnataka state in southern India (Figure 1). The
district lies between 15°42'57" and 16°26'39" latitude and
76°14'47" and 77°35'39" longitude, with a land mass of 835,843
ha (cropped area 695,000 ha) (Figure 1) and bound in the
north and south by the rivers Krishna and Tungabhadra. Agro-
climatically, it falls under the Northeast Dry Zone of Karnataka
(semi-arid eco-subregion) with a long term average rainfall of
just above 600 mm distributed over
kharif
and
rabi
seasons.
Much of the district is well irrigated by the Tungabhadra Dam
on the Tungabhadra River, and the Narayanpura Dam on the
Krishna River, covering an irrigated area of 185,000 ha, 72.2
percent of which is from canals. The arable rainfed area occu-
pies 405,000 ha. The major crops grown in the district include
paddy, sorghum, groundnut, sunflower, cotton, and pulses
(chickpea and pigeonpea). The rice-rice cropping system is
dominant in most irrigated areas. The soils of the district are
mainly deep black clayey (47 percent) and red (34 percent).
Satellite Images
Four Landsat-8 tiles were downloaded from the Earth Ex-
plorer, global land cover facility website (
usgs.gov/
). Images from the 2014 monsoon season and their
spectral characteristics are shown in Table 1. All the Landsat-8
tiles were converted into reflectance
/
documents/Landsat8DataUsersHandbook.pdf
) to normalize
the multi-date effect (Markham and Barker, 1986; Thenkabail
et al
., 2004) using the spatial modeler in ERDAS Imagine
®
(ER-
DAS, 2007). The 250-m, two-band
MODIS
data (centered at 648
nm and 858 nm; Table 1) collection 5 (
MOD09Q1
) were acquired
for every eight days during the crop-growing seasons from
January 2014 through December 2014. The data was acquired
in 12-bit (0 to 4,096 levels) and stretched to 16-bit (0 to 65,536
levels). Further processing steps are described in (Gumma
et
al
., 2015; Gumma
et al
., 2011b; Thenkabail
et al
., 2005)
.
RISAT-1
, C-band (5.35
GHz
)
HH
polarization, Medium Resolu-
tion
SAR
(
MRS
) temporal data sets were used to distinguish
direct seeded rice from transplanted rice. Data was acquired
every 25 days at a 37° angle of incidence
spaced phenologi-
cally appropriate to identify rice fields and provide informa-
tion on data sets (Table 1).
Ground Survey Data
A ground survey was conducted during the monsoon season
for the crop year 2014 to 2015. Data was collected at 238 loca-
tions covering the major cropland areas in the study area. All
location-specific data were collected from 250 × 250 meter
plots and consisted of location coordinates (latitude, longi-
tude), land-use categories, land-use (percent), cropping systems
during the monsoon season (through farmer interviews), crop
types, and watering method (irrigated/rainfed). Samples were
within large contiguous areas of a specific land-use/land-cover.
The locations were chosen based on pre-classification classes
and local expertise. The local experts also provided information
on cropping systems, cropping patterns and cropping inten-
sity (single or double crop), irrigation application, and canopy
cover ( percent) for the previous years for these locations from
their recorded data. Overall, 116 spatially well-distributed data
points (Figure 1) were used for class identification and labeling;
of these, 46 data points were used for ideal spectra generation
and an additional 122 were used to assess accuracy.
Figure 1. Raichur District, Karnataka, India.
T
able
1. C
haracteristics
of
M
ultiple
S
atellite
S
ensor
D
ata
U
sed
in
the
S
tudy
Sensor
Dates
Spatial
(m)
Bands
Band range
(µm)
Landsat-8
07 & 14
Nov 2014
30
1
0.433–0.453
2
0.450–0.515
3
0.525–0.600
4
0.630–0.680
5
0.845–0.885
6
1.560–1.660
7
2.100–2.300
RISAT-1
28 Jun 2014;
23 Jul 2014;
17 Aug 2014;
11Sep 2014;
06 Oct 2014
18
1
HH polarization
MODIS
(MOD09Q1)
2014
(16 days)
250
1
0.62–0.67
2
0.84–0.88
NDVI
- 1 to + 1
874
November 2015
PHOTOGRAMMETRIC ENGINEERING & REMOTE SENSING


