PHOTOGRAMMETRIC ENGINEERING & REMOTE SENSING
January 2014
11
Application
Frontiers
Since the launch of ERS-1 by the
European Space Agency (ESA),
satellite InSAR images have been used
to image surface deformation caused
by various processes, including:
•
ground surface deformation at vol-
canoes both between and during
eruptions, thereby providing in-
sights into the volcano’s structure,
magma plumbing system, and
state of unrest, and enabling bet-
ter assessment of volcanic hazards
(e.g., Lu, 2007);
•
ground surface displacements
before, during, and after large
seismic events, providing essential
information for: 1) determining
hypocenter location, fault geome-
try, rupture dynamics, and inter-
actions among neighboring faults,
2) inferring mechanical properties
of Earth’s crust and upper mantle,
and 3) mapping interseismic strain
accumulation to assess long-term
seismic hazards (e.g., Massonnet
et
al
., 1993; Biggs
et al
., 2007);
•
land surface subsidence associated
with fluid withdrawal, mining,
land reclamation, or slow-moving
landslides, thereby improving the
ability to assess and mitigate ad-
verse consequences (e.g., Zhang
et
al
., 2012; Zhao
et al
., 2012);
•
movement of glaciers and ice
fields, aiding the understanding
of global warming effects and
impacts on sea level change (e.g.,
Rignot and Thomas, 2002);
•
water-level changes in wetlands to
improve assessments of flood haz-
ards (e.g., Lu and Kwoun, 2008);
and,
•
floods, wildfires, changes in soil
moisture content, etc. Land cover
characterization can be significant-
ly enhanced when SAR imagery is
fused with optical datasets (Zhang
et al
., 2010; Amarsaikhana
et al
.,
2010; Datcu
et al
., 2112).
Extension to Infrastructure
Monitoring
Using PSInSAR to monitor
infrastructure has become a popular
research topic in recent years, due
to the availability of high-resolution
TerraSAR-X and COSMO-SkyMed
imagery and also to technical
advances in PSInSAR processing.
High-resolution PSInSAR results
from both descending and ascending
tracks can be fused, allowing the
retrieval of building shapes and
millimeter-scale displacements in
the east-west and vertical directions
(e.g., Gernhard
et al
., 2012) (Figure
1). Besides buildings, infrastructure
such as highways, railroads, bridges,
levees, dams, and storage tanks can
be effectively monitored by various
PSInSAR methods. PSInSAR is
becoming an important tool for
detecting and mapping infrastructure
hazards, which can improve safety,
reduce maintenance costs, and provide
warning of catastrophic failures.
Extension to Airborne and Ground-
based Systems
In the past, InSAR measurements
have been made mostly with SAR
images acquired by various radar
satellites (Table 1). Even though
satellite radars can provide routine
data collection over areas of
interest at a global scale, they lack
the flexibility to acquire images
frequently and in a timely fashion
— capabilities that can be critical in
emergency situations. In recent years
numerous airborne SAR platforms
have been developed, including
uninhabited aerial vehicle SAR
(UAVSAR) (e.g., Hensley
et al
., 2005).
Airborne SAR sensors can provide
better spatial resolution than orbiting
SARs, because they operate closer to
the target area. Flexibility in the time
and frequency of image acquisition
enables airborne SARs to monitor
transient phenomena that might be
missed or aliased by satellite SAR
measurements. In contrast to satellite
(e)
(b)
(d)
(c)
(a)
50 m
N
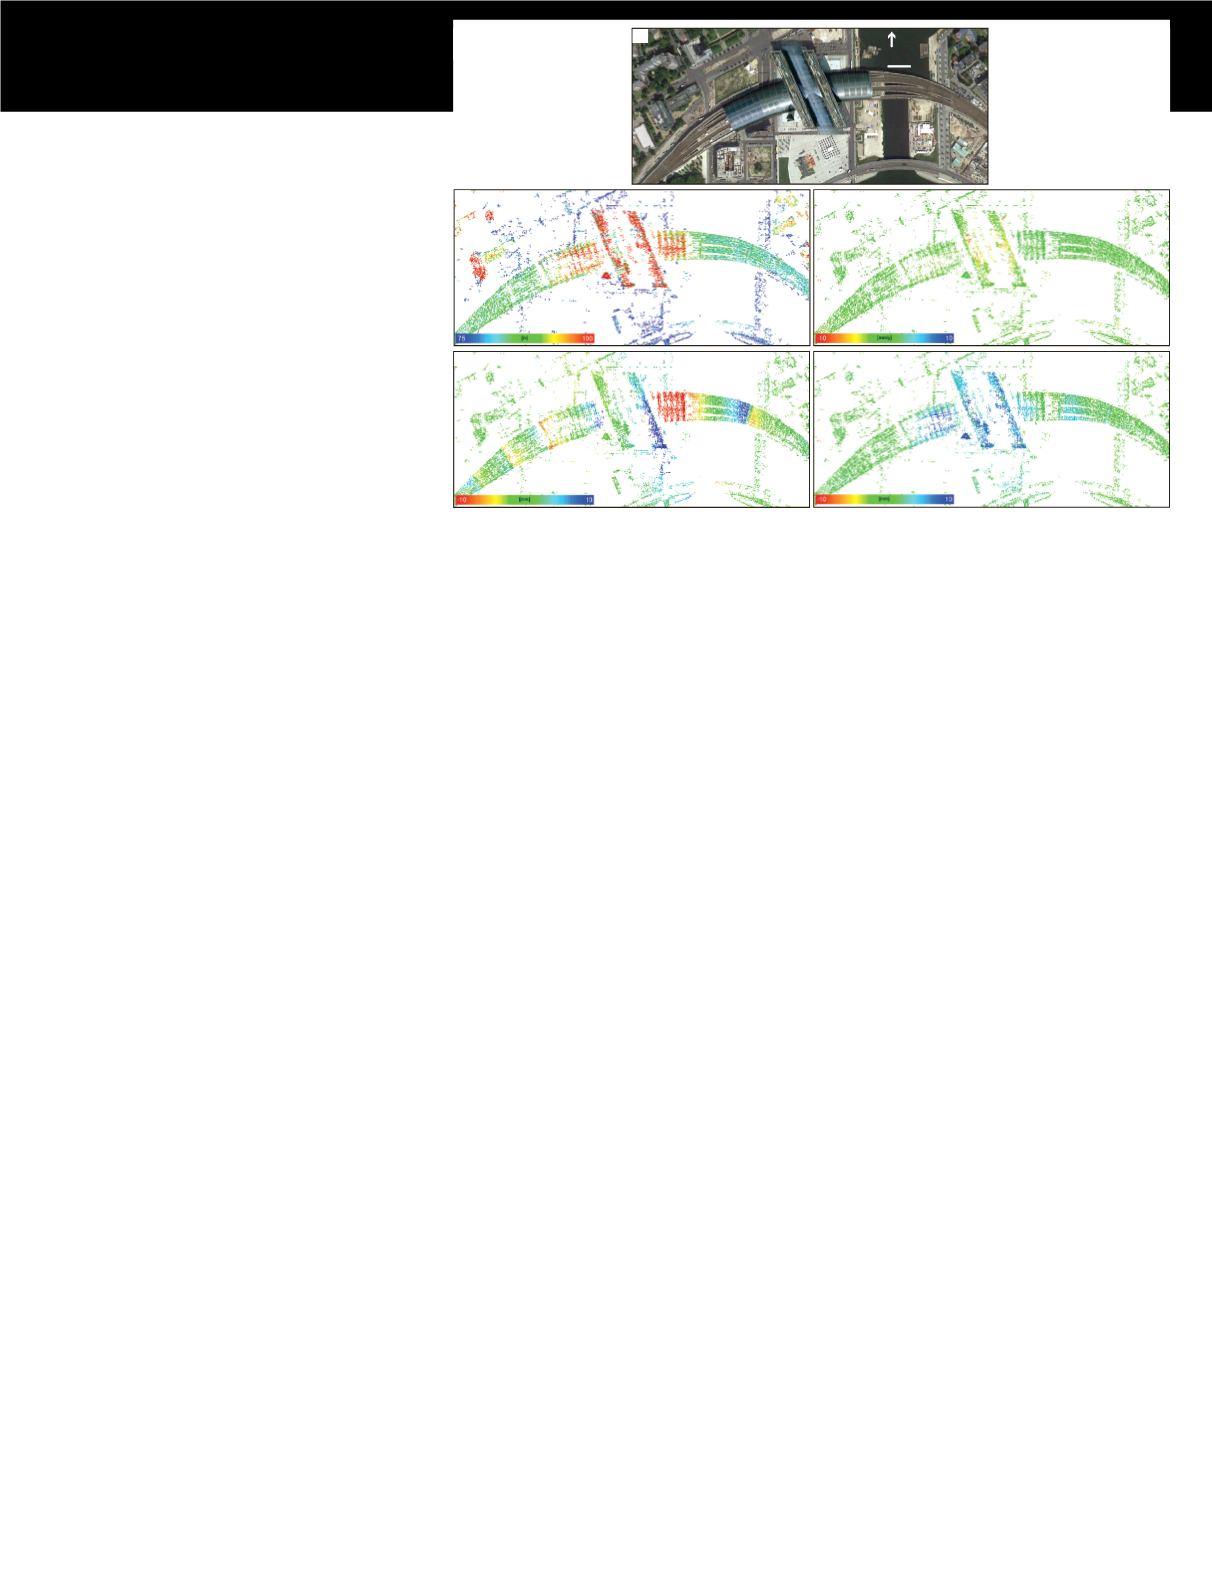
Figure 1. Multi-track PSInSAR analysis of the Berlin central train station based on
high-resolution spotlight mode TerraSAR-X PSInSAR composite images from both ascend-
ing and descending tracks. Each composite image consists of 25–35 individual images.
Results (including building heights, seasonal and long-term motion components in the
east-west and the vertical directions) are obtained by first applying separate PSInSAR
processing to the composite images from descending and ascending tracks, and then
fusing PS point clouds from the cross-heading tracks (Gernhardt and Bamler, 2012). (a)
Google image showing features of the study area. (b) PSInSAR-derived building heights.
(c) Estimated long-term linear motion component in the vertical direction. (d) Estimated
seasonal motion component (modeled with a sine function) in the east-west direction. (e)
Estimated seasonal motion component (modeled with a sine function) in the vertical direc-
tion. Images courtesy of S. Gerhardt (DLR).


