PHOTOGRAMMETRIC ENGINEERING & REMOTE SENSING
June 2014
487
Fawaz Ulaby, David Simonett, and Stanley Morain. Dr. Vic-
tor Myers of USDA, Weslaco, Texas, was funded by the USDA
to assess the utility of remote sensing for various agricultural
applications. Thus, there was a significant amount of research
being conducted at several locations around the country, all
dealing with remote sensing for agricultural and forestry ap-
plications, but with each team of researchers pursuing a rath-
er different aspect of remote sensing research (Hoffer, 1998).
D
eveloping
C
omputer
-A
ided
A
nalysis
T
echniques
At Purdue University, the initial effort concentrated on devel-
oping computer programs that would allow the researchers to
effectively interact with the multispectral scanner data. The
data for each wavelength band were first converted from ana-
log to digital format using an analog to digital converter. Com-
puter monitors or display devices of any sort did not exist at
that time, so to display the data, a line printer and different
alphanumeric symbols were used to represent different levels
of reflectance or emittance in a particular wavelength band,
thus providing a rough gray-scale map of the area (Figure 7).
For example, the letter M might be used to represent a low
reflecting pixel, while a -, /, or blank would be used to display a
high reflecting pixel. From a distance of several feet, a person
would not see the individual symbols, but only a crude gray-
tone map of the area. Columns and lines of the data were also
labeled so that each pixel had a specific set of X-Y coordinates.
This allowed the data analyst to define rectangles of known
cover types which could be used as “training fields”. Using this
training data and pattern recognition algorithms (e.g., nearest
neighbor, maximum likelihood, etc.), the spectral pattern of
each pixel could then be “classified” by the computer into one of
the training classes that had been defined. Early on, it became
clear that there was not always a nice one-to-one relationship
between the cover type classes that were identified as training
fields and the spectral classes present in the data. This led to a
renewed focus on understanding the spectral variability with-
in and between agricultural cover types and crop phenology.
In 1966, the University of Michigan flew three flight missions in
the vicinity of West Lafayette, Indiana (where Purdue University
is located). On February 15, 1967, LARS researchers achieved the
first successful application of pattern
recognition techniques to multispec-
tral scanner data. The data had been
collected on June 28, 1966 over an ag-
ricultural area designated as Flight
Line C-1, south of the Purdue Agrono-
my Farm. Because of limitations in the
analog to digital conversion process at
that time, only four wavelength bands
of data (0.44 - 0.46; 0.52 - 0.55; 0.62 -
0.66; and 0.72 - 0.80µm) were used in
the classification, and nine spectral/
informational classes were defined by
the training data. We were particular-
ly interested in the potential for “au-
tomatically” classifying winter wheat.
The classification results were dis-
played as a printout in which only the
points classified as winter wheat were
shown, using the letter W to represent
the winter wheat (Figure 8). One field
near the upper right portion of the
flight-line had oats planted in the mid-
dle and wheat planted in a rectangle
around the outside portion of the field,
and therefore became affectionately
known to many students and others
as the “donut field”. The results of this
successful classification of multispec-
tral scanner data were reported in
LARS Information Note 21567 titled
“Automatic Identification and Classi-
fication of Wheat by Remote Sensing”
by David Landgrebe and Staff of the
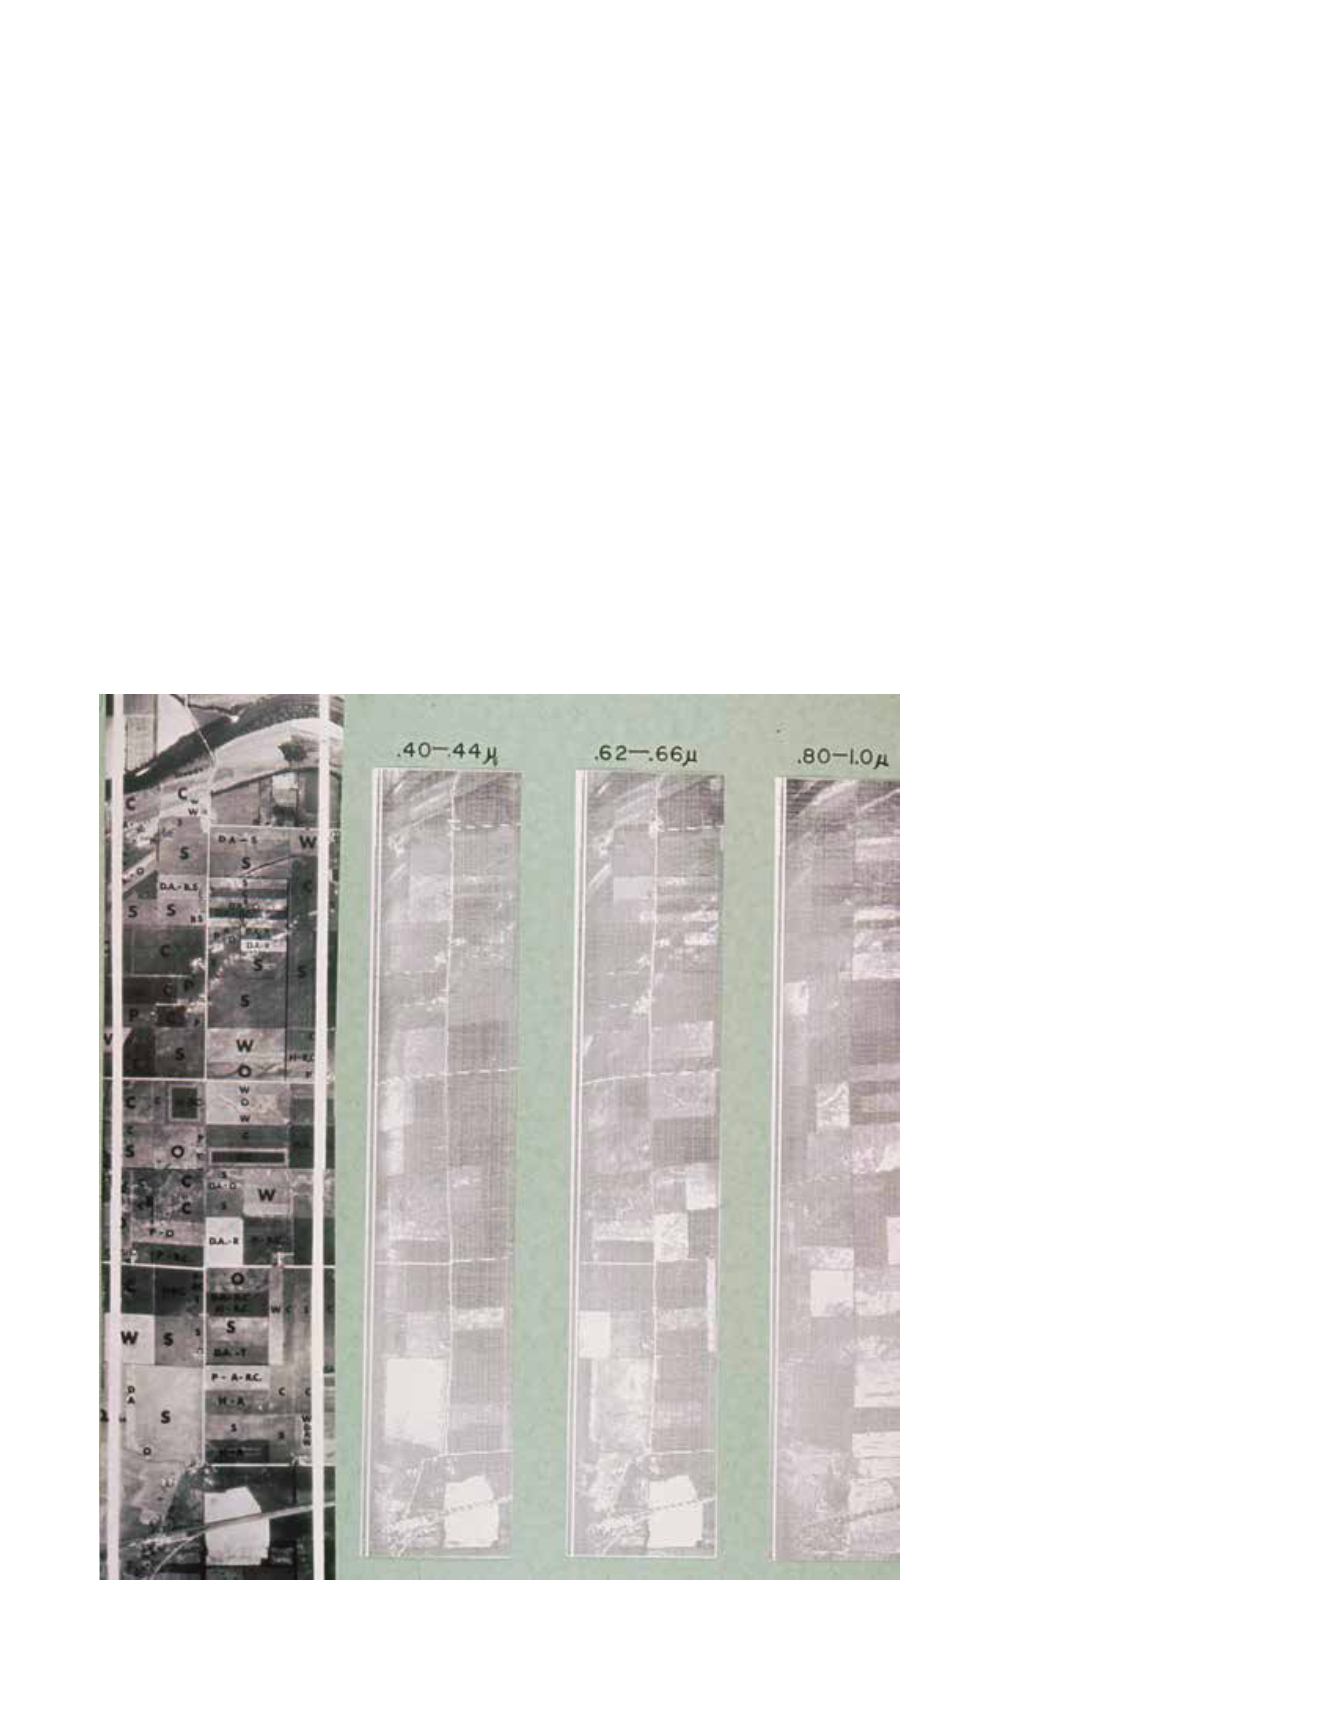
Figure 7. Labeled photo and computer “gray-scale” printouts of three wavelength bands of data.


