488
June 2014
PHOTOGRAMMETRIC ENGINEERING & REMOTE SENSING
Laboratory for Agricultural Remote Sensing,
which was published in March 1967. In the
LARS report, it was stated that out of 64,240
total points classified, 5,469 points were classi-
fied as wheat, thus indicating the potential for
using such computer processing techniques
not only for mapping a particular crop species,
but also for providing acreage estimates, if the
size on the ground of the scanner resolution
element is known. The classification results
reported in this publication proved for the first
time that the concept involving the application
of pattern recognition theory to the analysis
and classification of multispectral scanner
data was valid. This report is thus considered
to be one of the milestones in the development
of remote sensing technology.
The data from Flight Line C-1 was later
used in a supervised classification for all
crops present, and a “classification accuracy
matrix” was produced for the first time (Ta-
ble 2). It should be noted that in Table 2, the
results of the classification are based on the
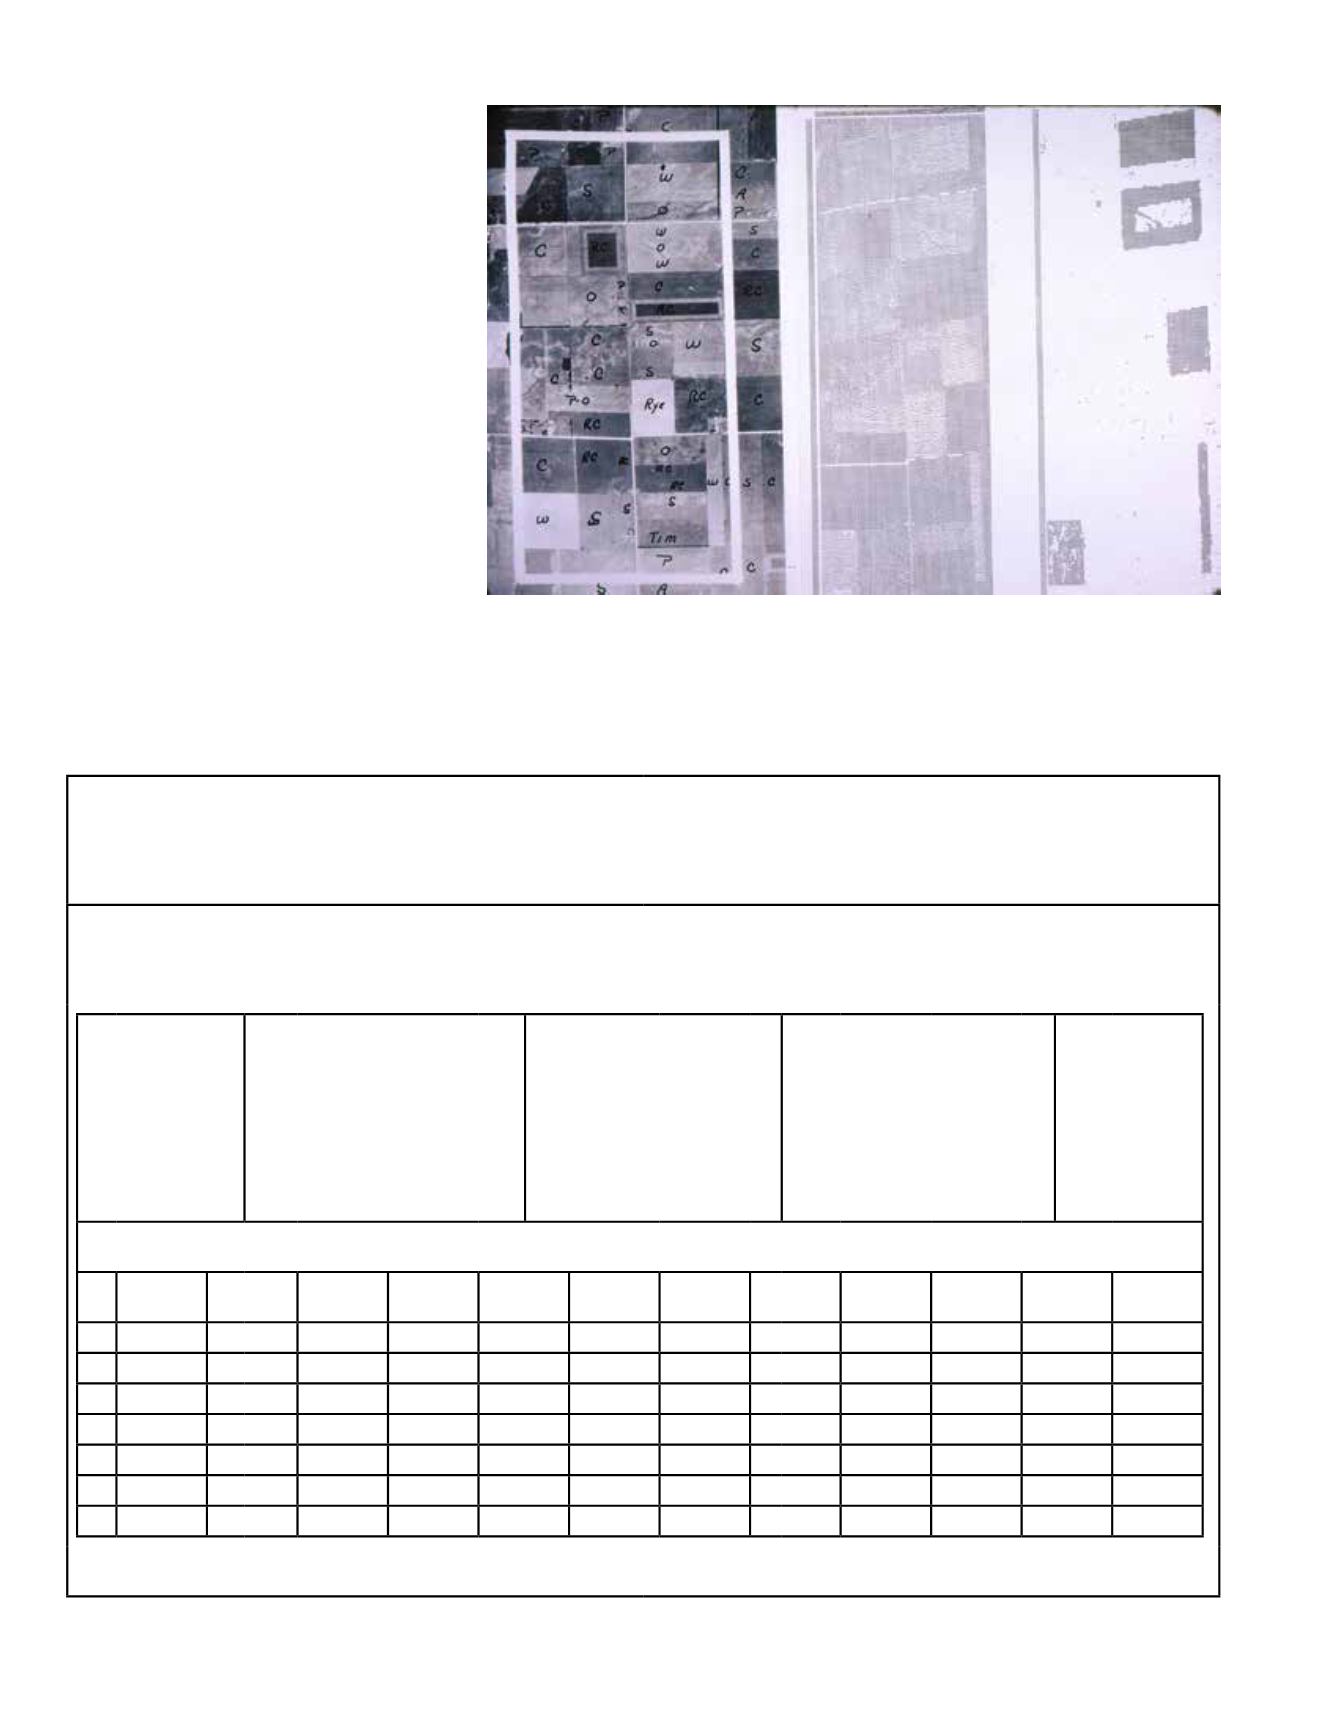
Figure 8. Left: Aerial photo with agricultural crop species and land use indicated, e.g., S = soy-
beans,W = winter wheat, O = oats, C = corn, R.C. = red clover, P = pasture, D.A. = diverted acres,
etc.; Center: Computer line printer “gray-scale” map of the multispectral scanner data obtained in
the 0.62 - 0.66 µm wavelength band for a portion of Flight Line C-1. Right: Printout of the com-
puter classification of winter wheat using multispectral scanner data. This was the first attempt to
use pattern recognition techniques to identify crop species.
Table 2. Summary of Classification Results Using Test Data (from: LARS Staff, 1970)
LABORATORY FOR AGRICULTURAL REMOTE SENSING
PURDUE UNIVERSITY
*** LARSYAA ILLUSTRATION ***
CLASSIFICATION STUDY......SERIAL NO. 705807300
CLASSIFICATION DATE JULY 5, 1968
RUN NUNBER—26600061
FLIGHT LINE—C1
TAPE NUMBER—102
CLASSES CONSIDERED
DATE—6/28/66
TIME—1229
ALTITUDE—2600 FEET
FEATURES CONSIDERED
SYMBOL
S
C
O
W
R
A
Y
X
W
CLASS
SOYBN I
CORN I
OATS
WHEAT I
RD CL I
ALFALFA
RYE
BR SOIL
WHEAT II
THRESHOLDS
14.900
14.900
14.900
14.900
14.900
14.900
14.900
14.900
14.900
CHANNEL NO.
1
6
10
12
S P E C T R A L
BAND
0.40 - 0.44
0.52 - 0.55
0.66 - 0.72
0.80 - 1.00
CLASSIFICATION SUMMARY BY TEST CLASSES
NO OF SAMPLES CLASSIFIED INTO
CLASS NO OF
SAMPS
PCT.
CORCT SOYB CORN OATS WHEA RED ALFA RYE SOIL THRS
1 SOYB
2368
85.9
2035
39
133
1
0
0
0
10
150
2 CORN
588
94.0
25
553
1
0
1
0
0
0
8
3 OATS
370
84.9
0
0
314
0
56
0
0
0
0
4 WHEA
806
91.2
0
0
17
735
0
0
48
0
6
5 RED
1401
85.9
2
20
38
0
1203
133
0
0
5
6 ALFA
456
87.7
0
4
21
0
29
400
0
0
2
TOTAL
5989
2062
16
524
736
1289
533
48
10
171
OVERALL PERFORMANCE = 87.5
AVERAGE PERFORMANCE BY CLASS = 88.3


