PHOTOGRAMMETRIC ENGINEERING & REMOTE SENSING
June 2014
489
use of test fields, as opposed to training data. In our data anal-
ysis, we called each sample point a “RSU” (Remote Sensing
Unit) -- what we now refer to as a pixel (picture element). This
particular classification involved six different crop species and
four of the twelve wavelength bands of the multispectral data
obtained by the U-M multispectral scanner.
In 1967, multispectral scanner data were obtained by the U-M
scanner system over a one mile wide, 70-mile long flightline in
central Indiana, and classifications of spectrally simple cover
types such as bare soil, green vegetation, and water were shown
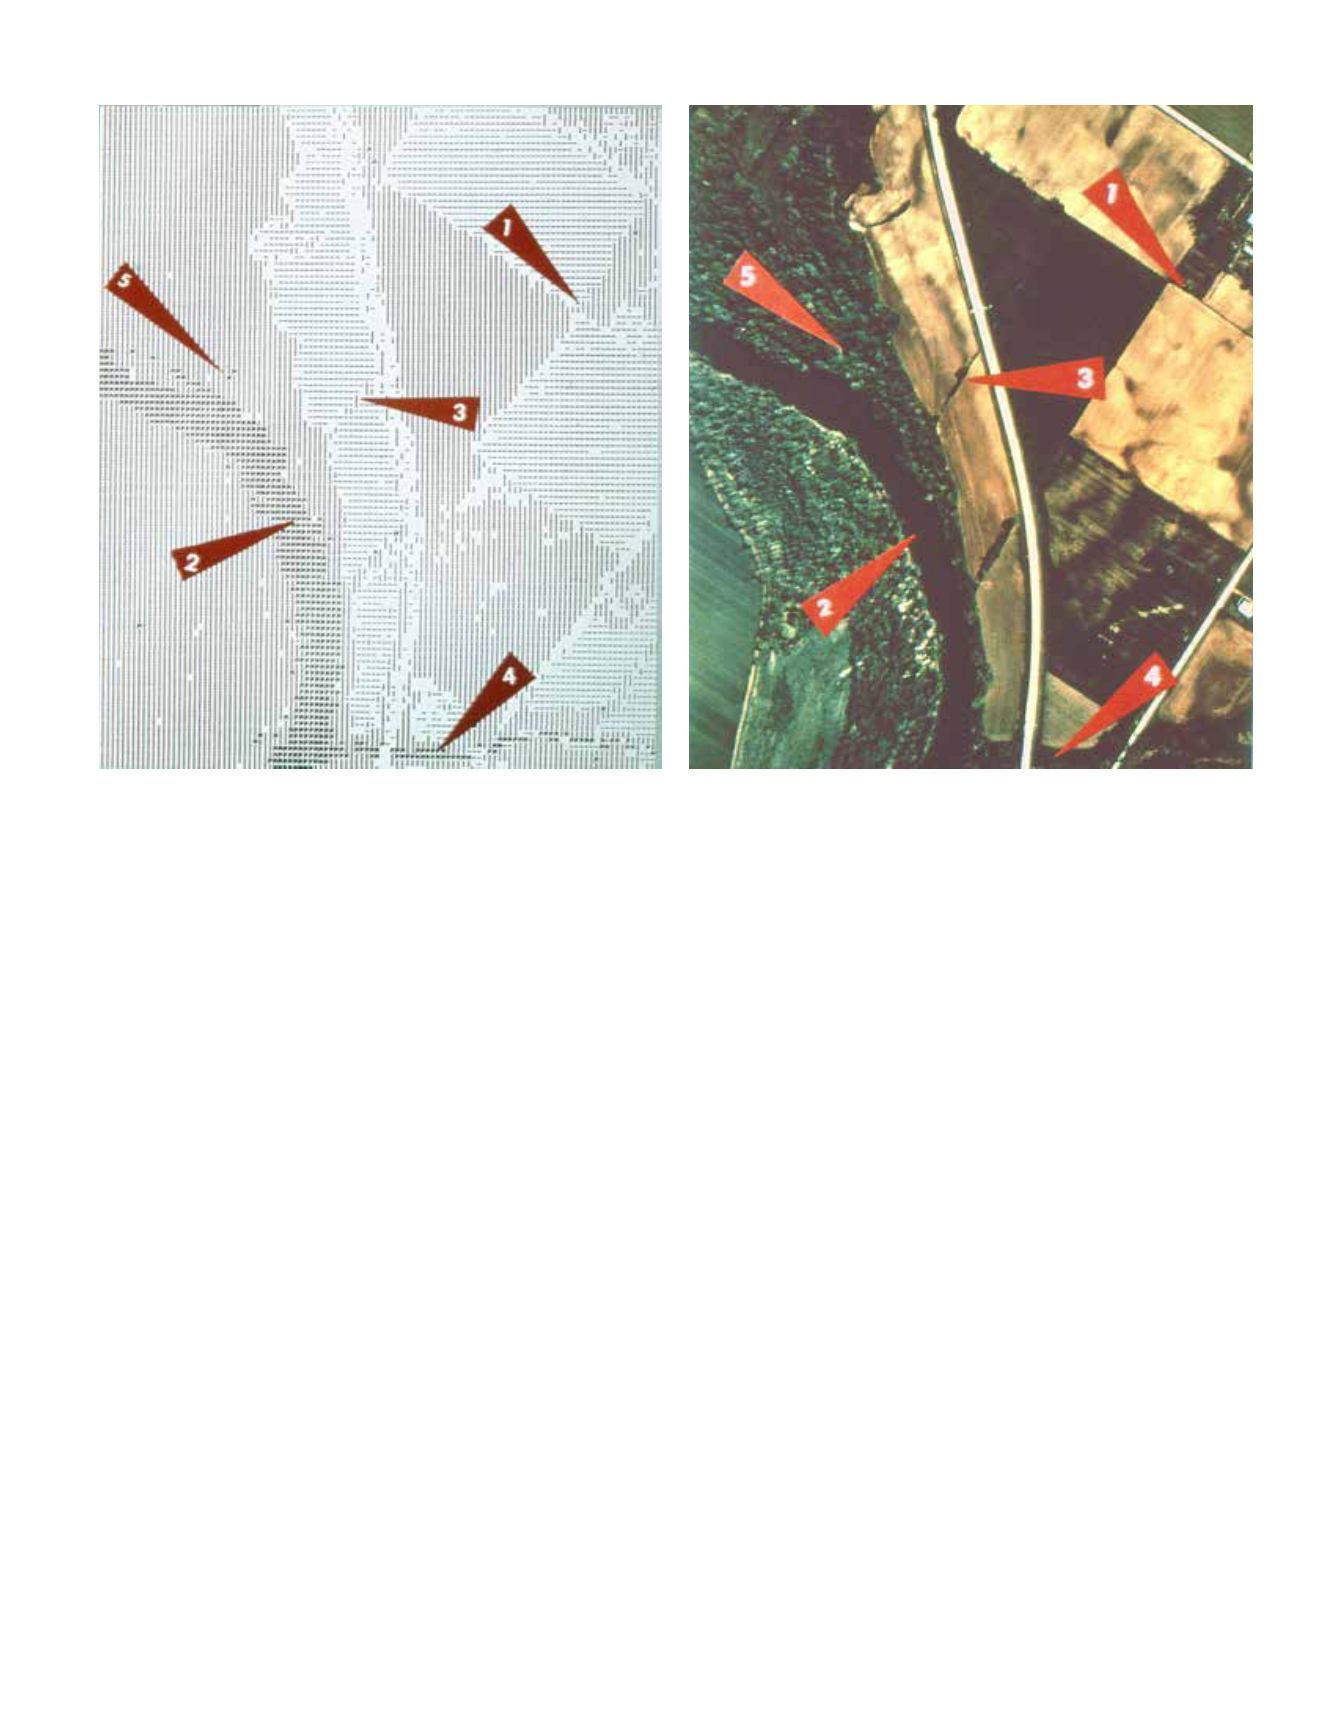
to be feasible using limited training data. Again, long sheets of
computer printout paper with different symbols were used to dis-
play the classification results. A very small section of these classi-
fication results is shown in Figure 9. The blank areas on the print-
out are pixels that were “thresholded” and not displayed in any
of the designated classes because they had such a low probability
of belonging to any of the designated spectral training classes.
Most of these thresholded pixels were either mixed pixels along
the edge of a field or were actually highway. Spectral differences
in soils were also mapped and analyzed over this 70-mile flight-
line, resulting in maps showing soils having high, medium and
low levels of reflectance, generally due to differences in organic
matter content. These soil classification maps were of particular
interest to the agronomists because of the potential to quantita-
tively map soil characteristics. These early results demonstrated
the effectiveness of computer classification of spectrally distinct
cover types for relatively large geographic areas.
L
earning
the
B
asic
P
rinciples
of
S
pectral
R
eflectance
One of the things that became quite evident during these early
studies was the need to develop a basic understanding of spec-
tral reflectance. Dr. Charles Olson, Jr., from the University of
Michigan was heavily involved in spectral reflectance research,
and he had developed a very effective field spectrophotometry
lab. A small house trailer held a Beckman DK-2A spectropho-
tometer that could measure reflectance in the ultra-violet, vis-
ible, near-infrared, and middle-infrared wavelengths (up to 2.6
µm). The reflectance was recorded on computer punch cards
at frequent spectral intervals, thus allowing one to record and
analyze the reflectance of various vegetation or soil samples
very effectively. Dr. Olson graciously loaned the DK-2 spec-
trophotometer lab to Purdue in the fall of 1964 and for the en-
tire 1965 growing season. This allowed my graduate students
and me to record several hundred spectra, representing many
different types of vegetation and soils. For each of the vegeta-
tion samples we also measured the moisture content, and for
about 10 percent of the samples, a cross-section of the leaf was
also obtained. These cross-sections started to give us excellent
insights about why differences in reflectance might exist. For
example, a corn leaf has a very different internal cell struc-
ture than a soybean leaf (Figure 10). Such differences in cell
structure of the leaves often resulted in statistically significant
differences in leaf reflectance at certain wavelengths. Analyz-
ing this spectral data, along with the associated moisture and
Figure 9. Computer classification of a portion of a 70-mile long flightline classified in 1967 into the following classes: bare soil (-), green vegetation (I), or
water (M). An aerial photograph is shown for comparison (from: LARS Staff, 1970).


