PHOTOGRAMMETRIC ENGINEERING & REMOTE SENSING
February 2016
83
alog of SERNAGEOMIN, which is so far only available
to authorized institutions within Chile. The IDE-SNIT
catalog can harvest more than 6,500 metadata records,
relative to analog, digital information, and web services
related to geological charts, volcanic hazard maps, and
mineral deposits. For example, when performing a search
using the keyword “Copahue,” a metadata record under
ISO 19115/19139 standard is deployed, and it is possible
to review its contents as it relates to the metadata pub-
lished by SERNAGEOMIN. The Chilean IDE-SNIT cat-
alog services are then brokered by the GEODAB service
for an easier search, discovery, and access to national and
international resources through the GEOSS geoportal.
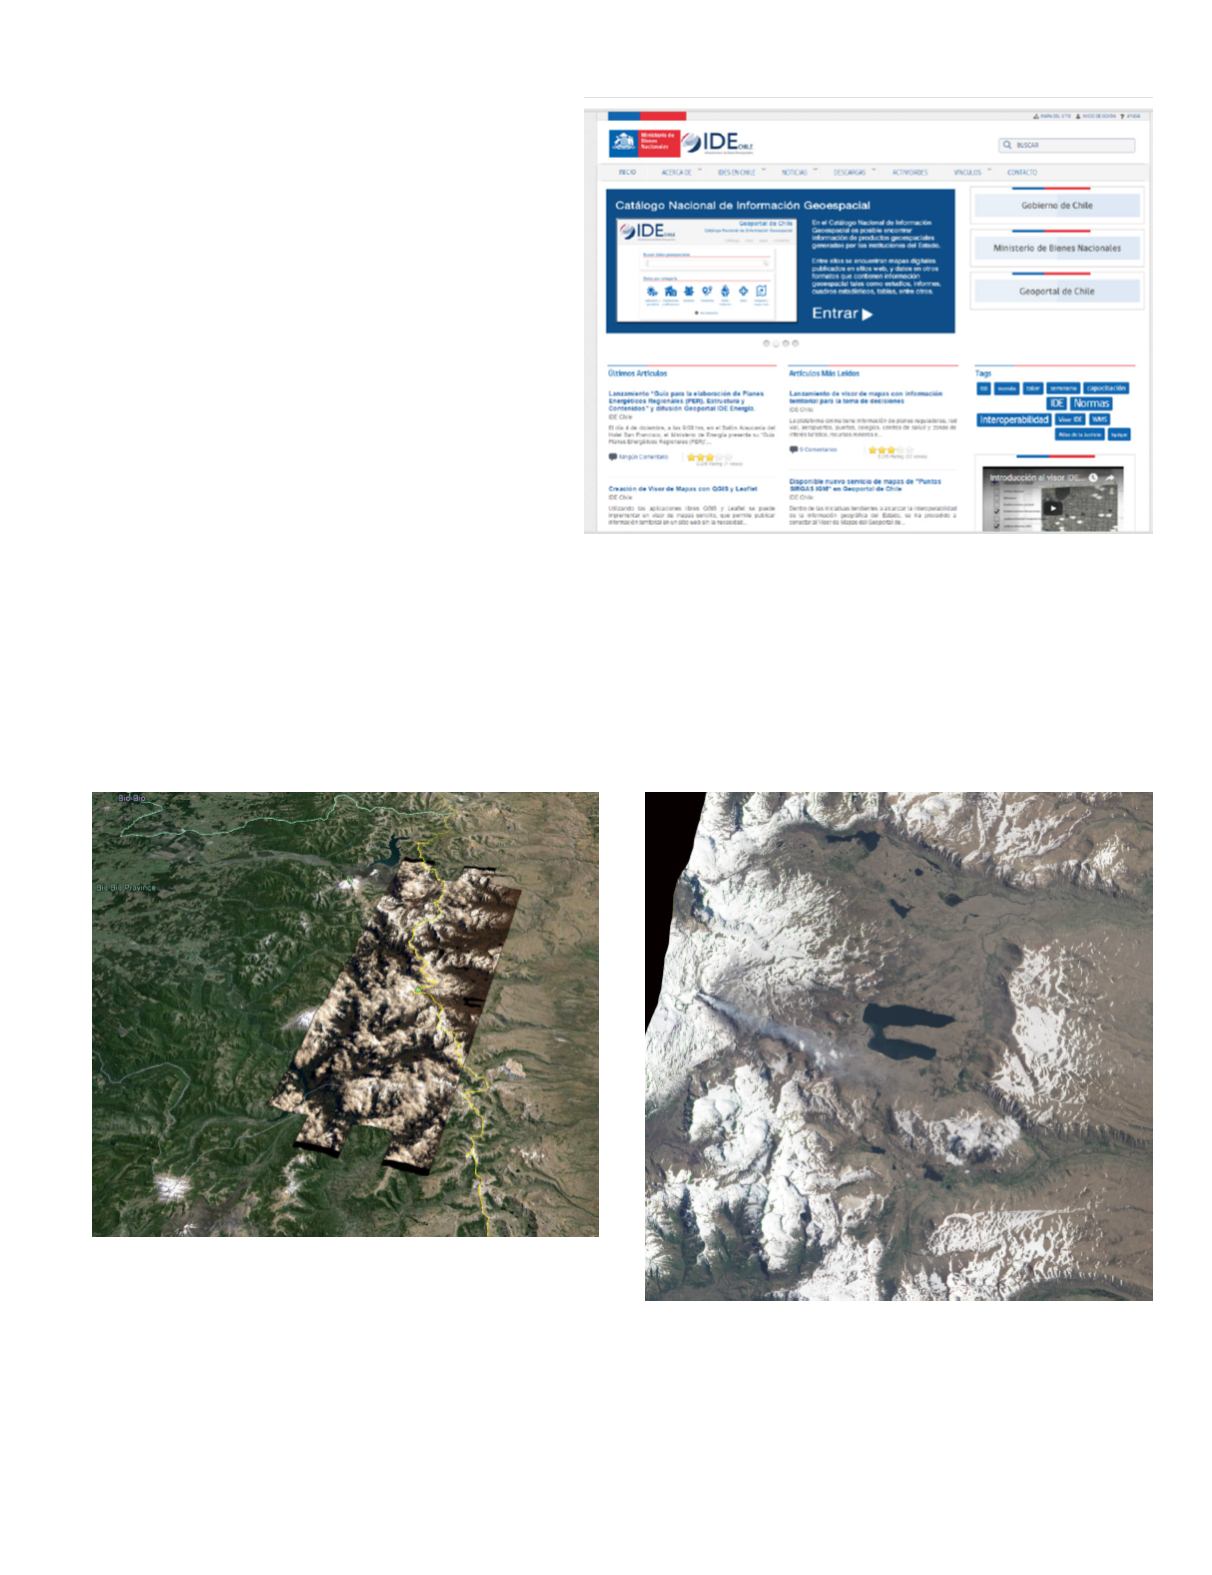
The result of a pilot web processing service for Copa-
hue, where a pan-sharpening algorithm was developed
by NASA, is shown in Figure 7a. Similarly, Figure 7b dis-
plays an image of Copahue from the EO-1 ALI satellite
sensor that contributes to the high-resolution imagery on
Chile’s Sistema Satelital para Observación de la Tierra
(SSOT), also known as FASat-Charlie. The EO-1 tasking
service pilot capability to execute observation acquisi-
tions by EO-1 satellite allows one to optimize the viewing op-
portunities of disaster areas and provide improved situation-
al awareness, as events unfold, within a spatial resolution of
10 m. Figure 8 shows a mashup formed by overlaying Google
Earth imagery with the raster layer resulting from the Web
Coverage Processing Service (WCPS) SWIR composite image
Figure 6. National Catalog of the Chilean Spatial Data Infrastructure (SDI) web
site, IDE-SNIT.
Figure 7a. Copahue volcanic region. Image of the testing volcanic
area Copahue from the EO-1 ALI of 8 October, 2014, overlaid on
Google Earth. Pan-sharpening algorithm - Testing - Copahue volcanic
region. EO-1 image provided courtesy of NASA. Processing done by
Lucia Lovison.
Figure 7b. Copahue volcanic region. Image of the testing volcanic
area Copahue from EO-1 ALI on 21 October, 2014. It is a natural
color image obtained by combining ALI visible spectral bands 1, 2, and
3 (30m resolution Red-Green-Blue channels) in selected proportions
and overlaying the resulting color image on the 10m panchromatic
band for high resolution “feathering” then cropping to show only the
zoom-in to the volcano Copahue site with annotations added. EO-1
image provided courtesy of NASA. Processing done by Stuart Frye.
of October 8, 2014. The optical image was collected through
the pilot satellite tasking service established on EO-1 and a pi-
lot web coverage processing service (WCPS) that used a SWIR
algorithm (Table 2) of L1G images taken by EO-1 ALI. The
resulting product was overlaid onto Google Earth in order to
monitor hot areas of volcanic activity in the Copahue region.


