extended to application in the Antarctic. Based on the
AWS
data (from Zhongshan Station and the Ross Ice
Shelf), a comparison between the retrieved
IST
results
and the
MOD
29 product is conducted.
The rest of this paper is organized as follows. The experi-
mental data and study areas are described in the next Section,
followed by theoretical aspects of the proposed processing
chain, including the
SWA
, the emissivity, and atmospheric
transmittance estimation. The next Section presents the algo-
rithm validation and the experimental results, comparisons,
and discussion, followed by the Conclusions.
Data Source
Satellite Data
The
MODIS
radiometer is operational onboard the polar orbit-
ing Terra and Aqua satellites of the NASA Earth Observing
System (
EOS
). It has a viewing swath width of 2,330 km and
covers most of the Earth’s surface within several days. The
satellite data products used in this research came from the
MODIS
radiometer. The general information about these data
products is summarized in Table 1.
The
TIR
bands used to retrieve the
IST
in this research were
derived from the
MODIS
L1b data (
MOD
021KM).
MOD
021KM
has 36 spectral bands between 0.405 and 14.385 μm, among
which the infrared bands 31 and 32 (centered on 11.03 and
12.02 μm, respectively) were used to retrieve the
IST
. The
ground resolution of these two bands is 1 km. The
MODIS
geo-
location data (
MOD
03) were used to reproject the
MOD
021KM
data. In addition, a
MODIS
cloud mask product (
MOD
35_L2)
was employed to remove cloud pixels in the
MOD
021KM data.
However, the accuracy of
MOD
35_L2 is limited. Improvement
of this product has been implemented, reducing the misidenti-
fication of cloud as clear to 16.3 percent, but the improvement
does not change the misidentification of clear as cloud (Hall
et al.
, 2012; Liu
et al.
, 2004; Frey
et al.
, 2008)). Moreover, a
further comparison (Liu
et al.
, 2010) showed that the
MOD
35
product performs better over open water than over sea ice.
The
MOD
29 product was used to evaluate the accuracy of
the proposed method by comparing it with the retrieved
IST
results. This product, which is generated using the
MODIS
L1b
data, the geolocation product, and the cloud mask product,
contains the sea ice extent product, the
IST
product, and so on.
In Situ
Data
In this research,
in situ
data (air temperature and wind speed)
from
AWS
s were used as reference. The two sets of
in situ
data
are plotted collectively in Plate 1. One set was provided by
the weather station located at Zhongshan Station, which is the
second Chinese Antarctic research expedition station. The de-
tailed location of this weather station is 69°22
′
S / 76°22
′
E (the
red star in Plate 1), on the Larsemann Hills, Prydz Bay, East
Antarctica. The other set was provided by the
AWS
s from the
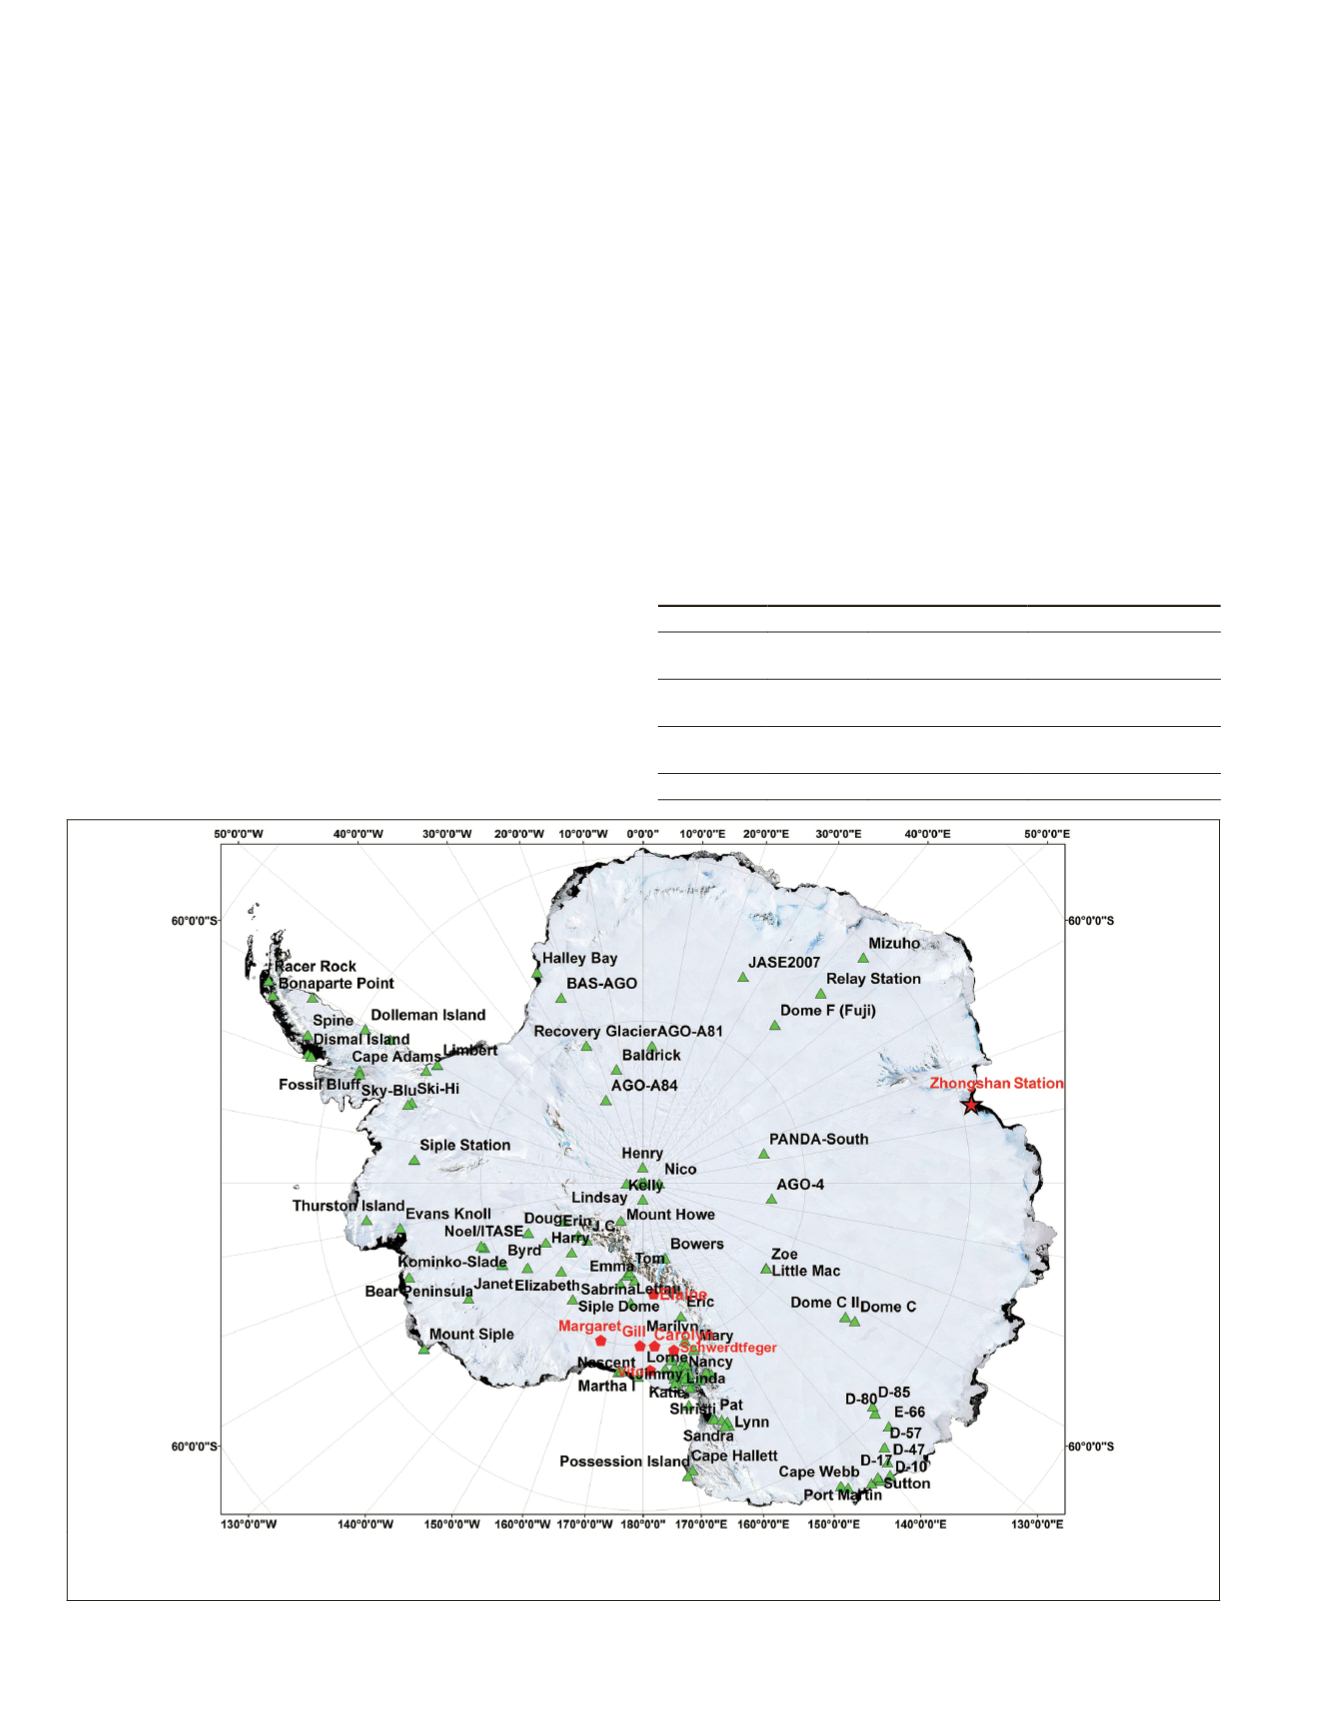
Plate 1. Automatic weather stations located in the Antarctic area. The stations used in this research are shown in red, with the Zhong-
shan Station AWS marked by a red star and the Ross Ice Shelf AWSs marked by red dots. The green triangles show the other AWSs from
the AMRC and the AWS program.
T
able
1. T
he
MODIS D
ata
P
roducts
U
sed
in
T
his
R
esearch
Product
Resolution Used bands
Application
MOD021KM 1 km
Band 2, Band 19,
Band 31, Band 32
IST retrieval using
the proposed method
MOD03
1 km
Band 1
Calibration for
MOD021KM
MOD35_L2 1 km
Band 1
Cloud pixel removal
for MOD021KM
MOD29
1 km
Band 2
Algorithm validation
862
November 2015
PHOTOGRAMMETRIC ENGINEERING & REMOTE SENSING


