while inadequate matches result in a large
E.
The error
metric
E
depends on the final geometric configuration
of both maps and the number of points in the lidar
stem center map.
The algorithm does not always guarantee better results than
the standard
ICP
method. In particular, the algorithm may not
perform better in situations where there are moderate outliers
present in the data. However, the algorithm will not provide
worse results than standard
ICP
, as it will default to the stan-
dard approach if distance error
E
cannot be improved further.
In addition, as seen in Figure 7 and Figure 8, stems ob-
served in overhead imagery are generally more than those
observed on the ground by the lidar. This is mainly due to, (a)
the presence of dense underbrush and other trees that obscure
the line of the sight of the lidar, and (b) the lidar has a limited
measurement range. These factors lead to lower number of
trees that are observed on the ground compared to overhead
imagery. This is a realistic constraint that was taken into ac-
count while developing the algorithm.
System Test and Simulation Setup
Without access to a real rover, and to simulate the envisaged op-
erational scenario, a ground vehicle was simulated in Matlab tra-
versing the 4-sided polygonal path and using the acquired over-
head imagery and lidar data as input. The simulated rover path is
illustrated as shown in Figure 5. More specifically, the acquired
lidar data from the Lake Mize site was gridded and incrementally
fed at each pose to the vision based localization algorithm.
It is noted that the rover path is composed of 234 poses
that are spaced at 0.5 m intervals. At each pose, lidar data is
sliced in 35 m × 35 m squares centered on each simulated
pose of the rover. These slices are used when the matching
algorithm is invoked and are fed to the lidar tree stem identi-
fication and extraction algorithm, which in turn detects and
labels tree stem centers for use by the matching algorithm.
Since the lidar dataset is of high accuracy, it was treated as
the ground reference to which geoposition estimates from the
localization algorithm are compared against. More specifically,
for our testing purposes, the algorithm’s estimated rover posi-
tion is graphed with the corresponding
GPS
location, which is
derived from the overlay of the simulated rover path onto the
lidar data. To assess the accuracy of position estimates, the
horizontal position error between the result provided by the
localization algorithm and the
GPS
estimate is calculated.
Overall Accuracy Results and Assessment
Ten full tests were performed that included processing and
labeling of input data by the localization algorithm in an end-
to-end fashion. The tests were differentiated by the geometry
of the path taken by the rover in simulation. In essence, due
to the different geometry of each path, slicing of the lidar data
was different and hence the paths would differ in the number
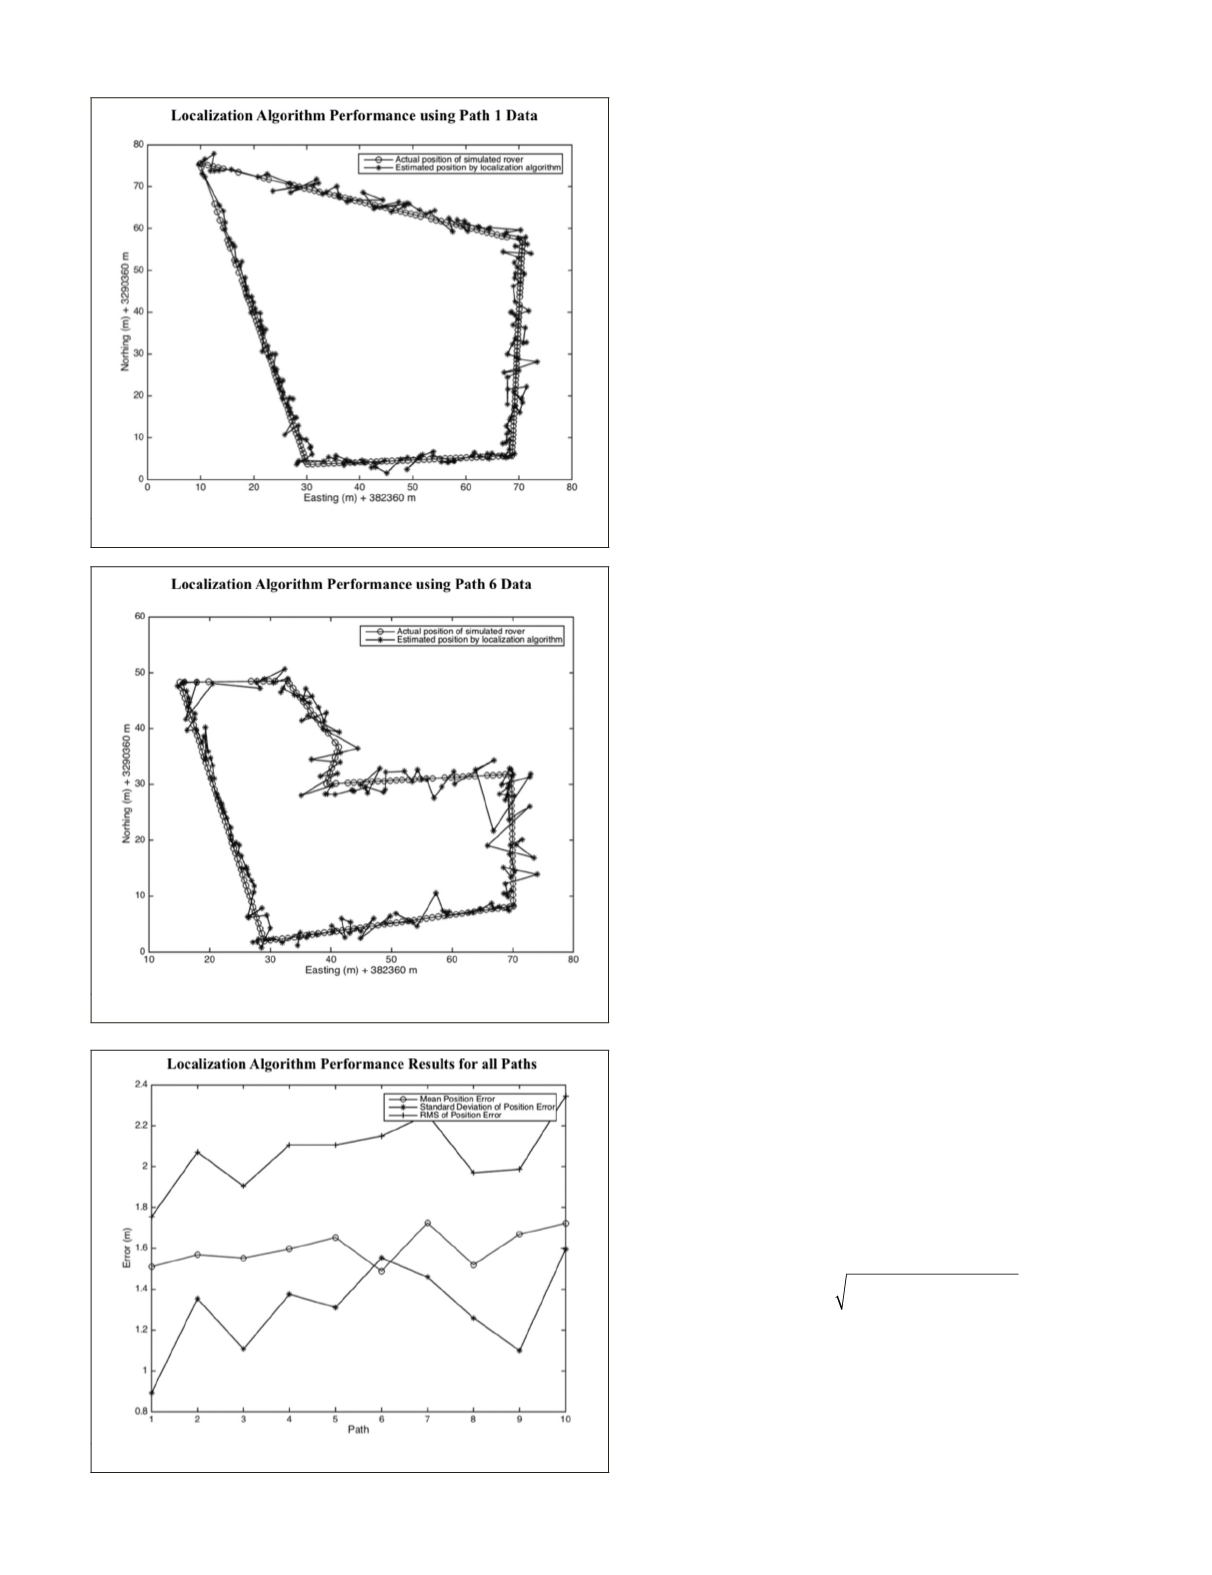
and geometry of stems observed from pose to pose. Figure 9
and Figure 10 show two examples of different paths taken
and the results from running the vision-based localization al-
gorithm. The error between the estimated and actual positions
at each pose was defined by:
Error
x x y y
i
i
a
i
e
i
a
i
e
= −
(
)
+ −
(
)
2
2
(3)
where
x
a
i
and
y
a
i
are the absolute (true) easting and north-
ing coordinates of the rover at pose
i
, and
x
e
i
and
y
e
i
are the
algorithm’s estimated easting and northing coordinates of the
rover at pose
i
.
The mean position error, standard deviation, and Root
Mean Squared (
RMS
) error for all test runs are shown in Figure
11. The mean rover position error for all test runs agrees to
Figure 9. Result from Path 1 Simulation.
Figure 10. Result from Path 6 Simulation.
Figure 11. Simulation Results per Path.
PHOTOGRAMMETRIC ENGINEERING & REMOTE SENSING
November 2015
845


