the GCP coordinates of five checkpoints. These checkpoints
were the remaining five
GCPs
and were not involved in the
bundle adjustment computation.
Because the error sources are independent of the imag-
ing rate (imaging interval
∆
t
), the ground position accuracy
of 3.8 mm is maintained at different data collection speeds.
Therefore, the uncertainty involved in the distance for com-
puting the speed of a surface feature from the two positions
is
σ
Distance
=
√
2
–
σ
Position
= 5.4 mm. Hence, the capability of this
system for detecting a surface feature speed is
V
Min
>
√
2
–
σ
Position
/
∆
t
= 5.4 mm /
∆
t
(3)
where
∆
t
is the time between two images.
V
Min
should be greater
than 0.11 m/s at an imaging rate
of 20 pairs per second. This speed
detection accuracy is sufficient for
the surface feature deformation
speed of the experiment, which
ranged from 0.2 m/s to 0.8 m/s.
V
Min
would be greater than 0.32
m/s if the images in this experi-
ment were acquired at an imaging
rate of 60 pairs per second. Under
those conditions, surface features
with a speed of 0.2 m/s to 0.32
m/s might not be detected with
high quality. However, in prac-
tice, the higher surface feature
speeds can be detected by select-
ing images that pair across several
imaging intervals (n
∆
t
,
n
> 1), as
long as the targeted surface fea-
tures appear in the paired images.
The speed maps and the
velocity vectors are all based
on the matched and tracked
features from time
t
k
to time
t
k
+1
.
The stable and sliding features
provide information in areas
with no changes and speed
values. However, in areas where
changed features at
t
k
may have
disappeared at
t
k+1
because there
may be a large surface deforma-
tion or the features were untrace-
able at
t
k
+1
using the tracking
method, the 3D positions and
speeds of the features were not
estimated. Their speed values
in the speed maps were inter-
polated. These changed features
and areas were also detected
using
P
CF
values derived from the
HSCS
images. Because the time
interval between the
HSCS
stereo
image pairs is very short (0.05
seconds), the changes in these
areas between two sequential
speed maps are generally small.
Discussion on Correlation of Signals
Derived from Imaging and Contact
Sensors
Although this paper focuses on
the imaging sensors, it is useful
to briefly compare the slope
deformation signals derived from
the imaging and contact sensors.
A detailed analysis of the data
collected by the network of the contact sensors is presented in
Lu
et al.
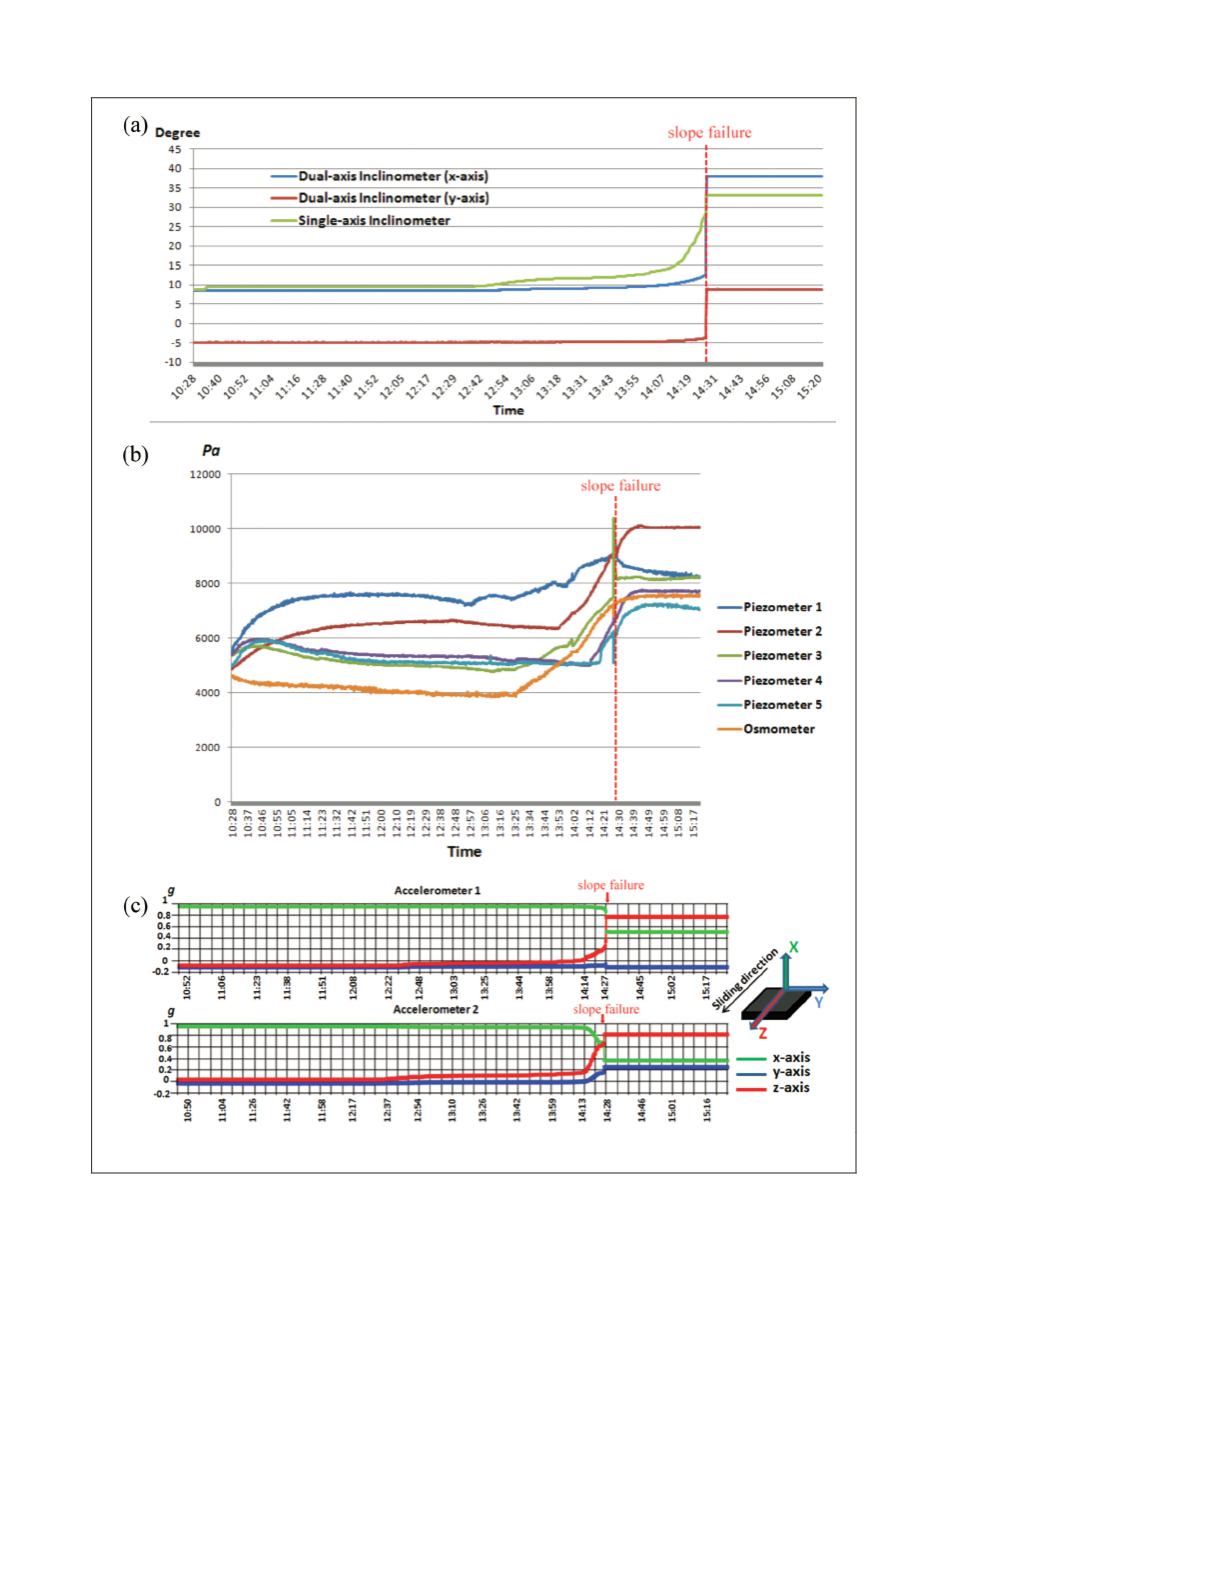
(2015). Observations of four types of contact sensors
are illustrated in Plate 5, including two inclinometers (one
dual axis and one single axis), five piezometers, one osmom-
eter, and two accelerometers. It is clear that both imaging
sensors (Figures 3 and 4) and contact sensors (Plate 5) collec-
tively determined the final collapse event at 14:27. However,
they showed differences in activities prior to the collapse.
For instance, the acceleration measurements started to have
significant increases at 14:12, about 15 minutes before the
collapse (Plate 5c). The single axis inclinometer recorded a
rapid increase of 14 degrees also within last 15 minutes (Plate
5a), but it showed a gradual increase of 4 degrees starting at
Plate 5. Observations from contact sensors: (a) inclinometers, (b) piezometers and osmometer,
and (c) accelerometers.
PHOTOGRAMMETRIC ENGINEERING & REMOTE SENSING
July 2016
555


