eCognition
®
) provide user friendly and efficient tools
for such finishing purposes.
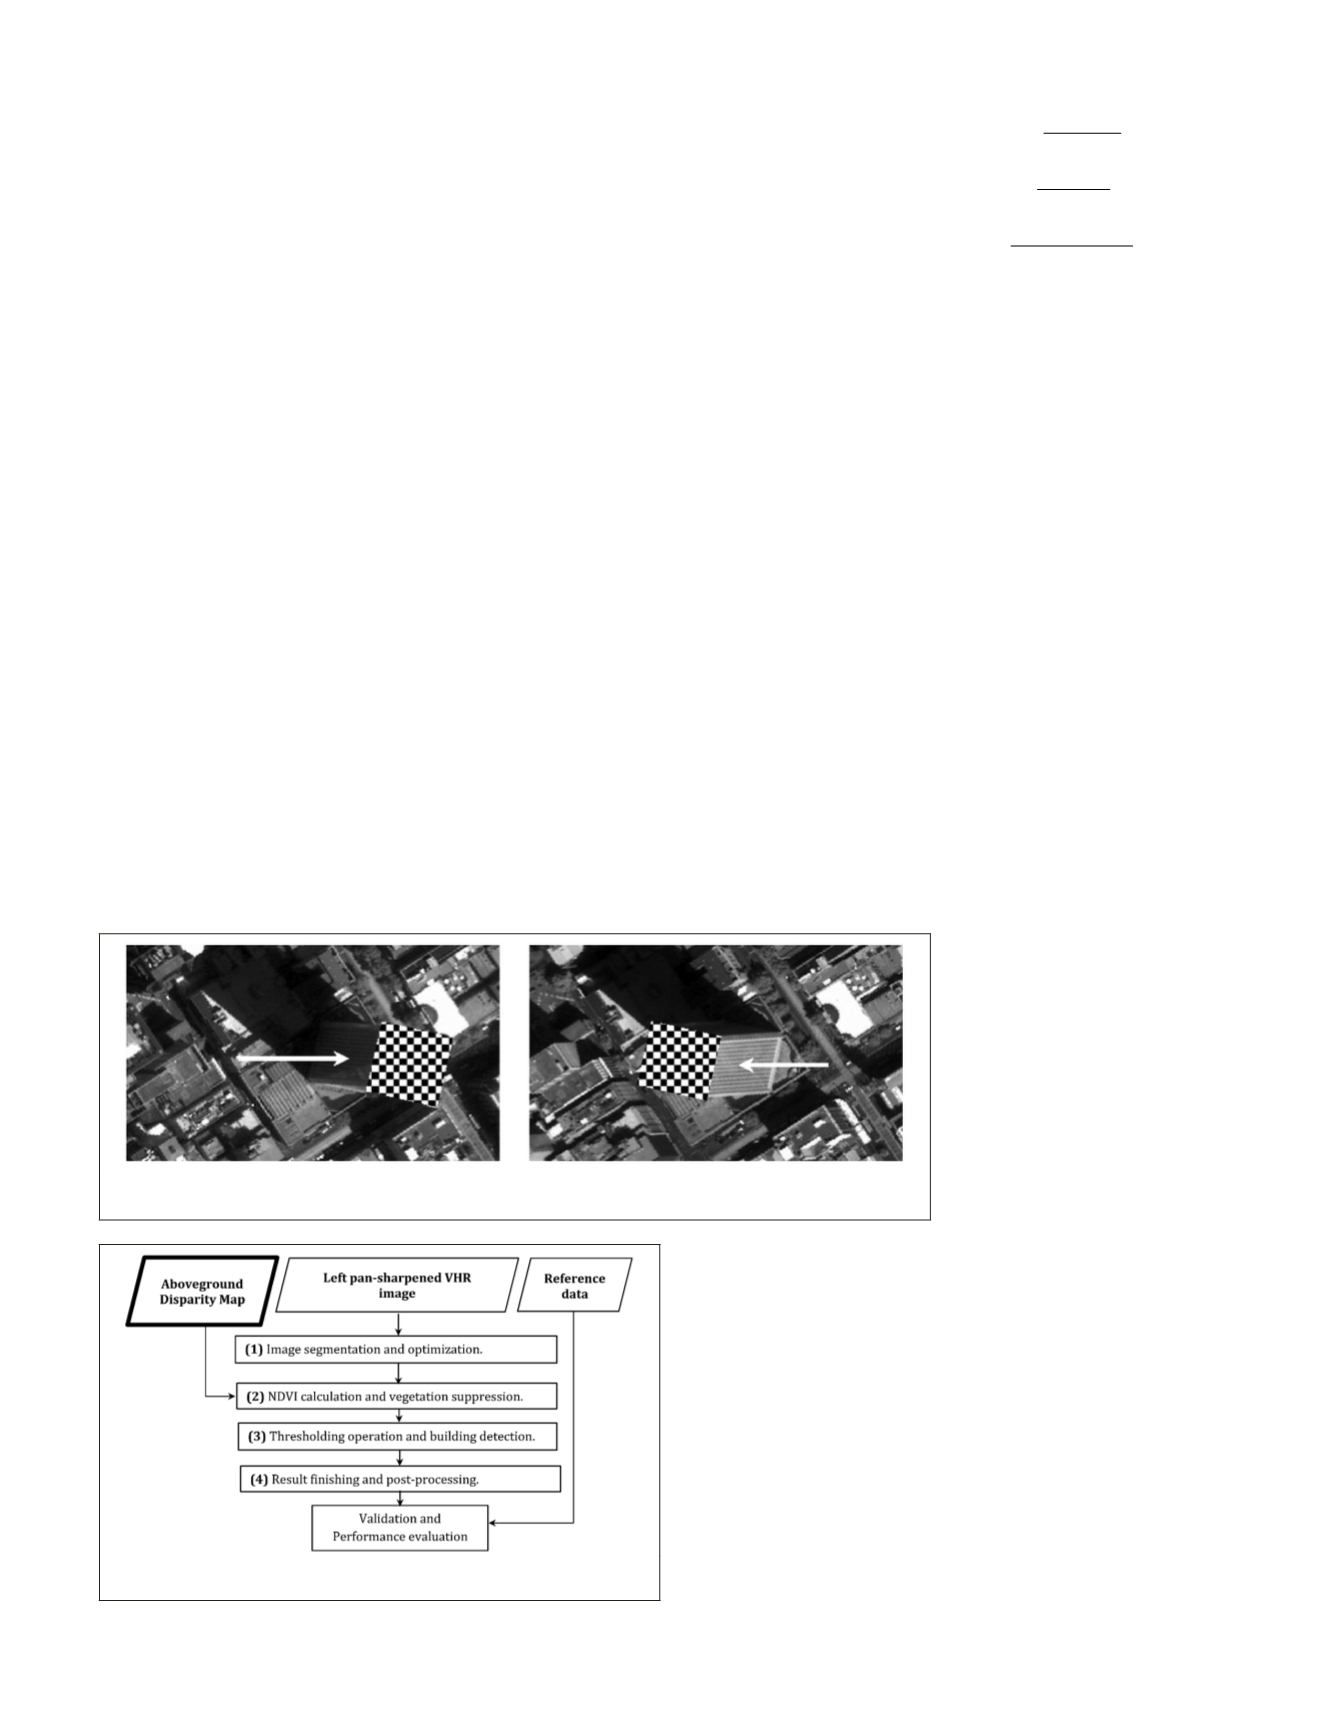
The whole proposed approach for disparity-based
building detection described above is flowcharted in
Figure 5. The bolded parallelogram in Figure 5 under-
scores that the critical input for detecting buildings is
the aboveground disparity map.
Validation Procedure
The main intent of this section is to prove the efficiency of the
developed procedure as well as its advantages. Accordingly,
two tests are devised to validate the results of the technique
developed in this research. The first is to evaluate the build-
ing detection performance relative to reference data; the sec-
ond is to evaluate the results achieved by the developed
RMAD
technique against those achieved by closely related published
techniques. The proposed evaluations are detailed in the fol-
lowing subsections.
Accuracy Assessment of Building Detection
Accuracy is assessed by evaluating the detected buildings’
roofs against a reference dataset after implementing the devel-
oped building detection procedure. Completeness, Correct-
ness, and Overall Quality are three widely used measures to
assess detection performance. These detection measures are
an adapted version of the classification accuracy assessment
measures originally introduced by Story and Congalton (1986)
which are referred to as producer’s accuracy, user’s Accuracy,
and overall accuracy, respectively. Completeness is the per-
centage of the entities in the reference data that are correctly
detected. Correctness indicates how well the detected entities
match the reference data. The Overall Quality of the results
provides a compound performance metric that balances
Completeness and Correctness. The formulas of these three
measures are described by Rutzinger
et al.
(2009) as follows:
Completeness Comp
TP FN
(
.)
=
+
TP
(4)
Correctness Corr
TP FP
(
.)
=
+
TP
(5)
OverallQuality OQ
TP FP FN
( )
=
+ +
TP
.
(6)
True positive (
TP
) is the number of correctly identified
building roof segments. The false negative (
FN
) is the number
of building roof segments in the reference dataset that are
not detected. The false positive (
FP
) represents the number
of building roof segments that are detected but do not corre-
spond to the reference dataset. It is worth mentioning that the
detection assessment can be pixel-based or object-based (Rot-
tensteiner
et al.
, 2005; Rutzinger
et al.
, 2009). However, the
definition for these measured entities in this study represents
the total number of pixels that are labeled as roof.
Comparative Evaluation of Building Detection
Following the main argument for this study, the procedure for
building detection centred around
RMAD
-generated disparity
map bypasses the normally required interpolation step (to
fill data gaps caused by occlusion) and the terrain extraction
process (to normalize the
SDM
). As a result, there is a need to
evaluate the impact of circumventing these two steps on the
quality of building detection. Accordingly, building detection
results based on the developed
RMAD
technique are compared
to the results obtained from a disparity map generated based
on an
RFM
-based epipolar image pair. This
RFM
epipolarity
model, as introduced by Zhao
et al.
(2008), creates epipolar
rectified images without considering the changes in terrain
relief distortions.
The
RFM
-based epipolarity technique uses a pre-selected
set of evenly distributed object space elevations and the
two forms of
RFM
model: the image-to-ground (backward)
model and the ground-to-image
(forward) model. For an im-
age pixel in the left image, the
former model is used to calculate
the corresponding planimetric
object-space coordinates for
a set of elevations. Then, the
latter model is used to project
the calculated 3D object-space
coordinates to the image-space of
the right image. By repeating this
process for a set of evenly dis-
tributed elevations, the epipolar
images can be resampled with-
out rectifying the terrain relief
distortions (Zhao
et al.
, 2008).
Following the creation of the epipolar pairs, the next step
is to generate the corresponding surface disparity map (
SDM
)
using the
SGM
algorithm. An interpolation step is required
afterward to fill the gaps in the disparity map caused by the
occlusion effects. This is followed by the extraction of the ter-
rain level disparity model (
TDM
) since terrain relief distortions
are not rectified by the
RFM
-based epipolarity technique. The
terrain extraction technique selected for this step is the local
minima technique developed by Zhang
et al.
(2004) because it
is the most successful one among the reviewed techniques.
Subsequently, the
TDM
is subtracted from the
SDM
to obtain the
normalized disparity map (
nSDM
) which is then used in the dis-
parity-based building detection procedure previously described
in the Methodology Section. Finally, the detected buildings’
rooftops are evaluated against the reference data. Figure 6 depicts
the work flow for the steps described in the previous paragraphs
Figure 4. Due to the different viewing angles for VHR linear sensors, building façades that appear
in the backward image (left) do not appear in the forward one (right).
Figure 5. The work flow for stereo-based building detection using
normalized disparity information.
PHOTOGRAMMETRIC ENGINEERING & REMOTE SENSING
July 2016
539


