Results of Building Detection Based on Conventional Techniques
The disparity-based building detection procedure developed
by the authors and described in the Methodology Section was
implemented using the output from the previous steps. Spe-
cifically, the epipolar images were generated based on Zhao
et al.
(2008), and the normalized disparity map was generated
following the approach of Zhang
et al.
(2004). The building
rooftops detected based on our approach are shown in Figure
11, which indicates that the achieved result is of low quality.
The false positive detection of
building rooftops, shown in light
gray in Figure 11b, are mainly on
the narrow roads and between
buildings. The accuracy evalua-
tion measures for this result are
provided in Table 2.
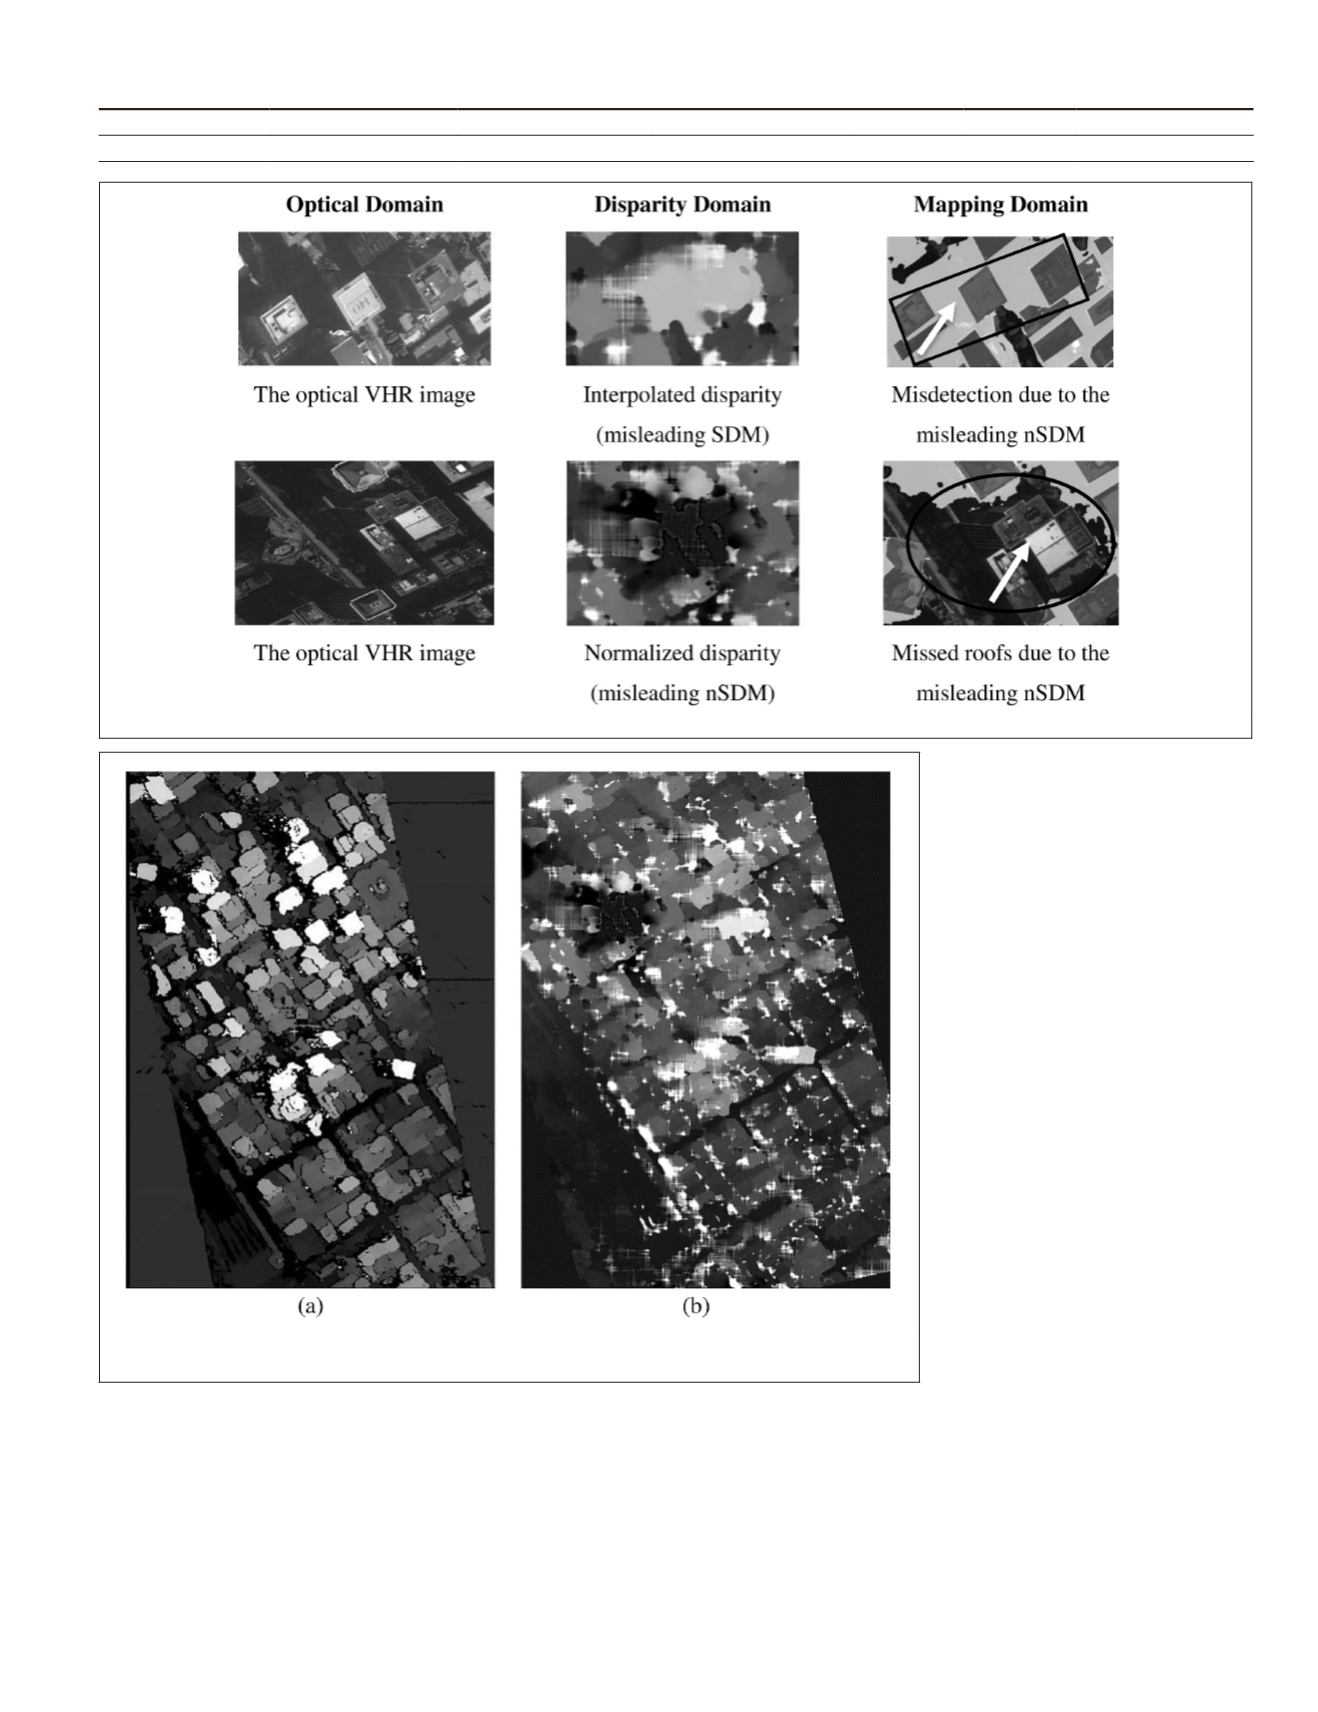
Figure 12 depicts two major
negative outcomes identified in
dense urban areas. In this respect,
two specific areas marked in
Figure 11b are magnified in the
optical, disparity, and mapping
domains respectively in Figure 12.
The upper row of Figure 12 repre-
sents the effect of interpolating the
resulting gaps in the disparity map
generated in dense urban areas
that led to false positive detection
shown in light gray. The lower row
represents the effect of normal-
izing the surface disparity result-
ing from subtracting the extracted
terrain disparity model which led
to missing building roofs.
Results Comparison and Discussion
Results of the Achieved Aboveground
Disparity Maps
A comparison between the aboveground disparity maps gener-
ated based on the developed
RMAD
technique versus the nor-
malized map achieved using the conventional techniques is il-
lustrated in Figure 13. The
RMAD
-based disparity map (Figure
13a) shows that the disparity values of the narrow ground-lev-
el roads are almost eliminated and the adjacent building roofs
are isolated even without trees suppression. Conversely, when
the conventional normalization method (local-minima-based
T
able
2. A
ccuracy
M
easures
for
B
uilding
D
etection
B
ased
on
P
ublished
T
echniques
for
E
pipolar
I
mage
G
eneration
and
S
urface
D
ata
N
ormalization
Evaluation measures True Positive (pixels) False Positive (pixels) False Negative (pixels) Comp. (%)
Corr. (%)
Overall Quality (%)
Values
1099321
1210323
242470
82
48
43
Figure 12. The two identified interpolation problems.
Figure 13. (a) Comparison between the achieved aboveground disparity map generated by
RMAD, and (b) the surface disparity map (nSDM) normalized by local-minima-based technique.
PHOTOGRAMMETRIC ENGINEERING & REMOTE SENSING
July 2016
543


